Automated lipid identification and quantification by multidimensional mass spectrometry-based shotgun lipidomics
- PMID: 19408941
- PMCID: PMC2728582
- DOI: 10.1021/ac900241u
Automated lipid identification and quantification by multidimensional mass spectrometry-based shotgun lipidomics
Abstract
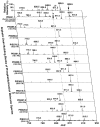
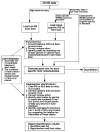
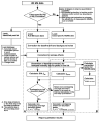
This article presents the strategies underlying the automated identification and quantification of individual lipid molecular species through array analysis of multidimensional mass spectrometry-based shotgun lipidomics (MDMS-SL) data, which are acquired directly from lipid extracts after direct infusion and intrasource separation. The automated analyses of individual lipid molecular species in the program employ a strategy in which MDMS-SL data from building block analyses using precursor ion scans, neutral loss scans, or both are used to identify individual molecular species, followed by quantitation. Through this strategy, the program screens and identifies species in a high-throughput fashion from a built-in database of over 36,000 potential lipid molecular species constructed employing known building blocks. The program then uses a two-step procedure for quantitation of the identified species possessing a linear dynamic range over 3 orders of magnitude and reverifies the results when necessary through redundant quantification of multidimensional mass spectra. This program is designed to be easily adaptable for other shotgun lipidomics approaches that are currently used for mass spectrometric analysis of lipids. Accordingly, the development of this program should greatly accelerate high-throughput analysis of lipids using MDMS-based shotgun lipidomics.
Figures


References
-
- Han X, Gross RW. Expert Rev Proteomics. 2005;2:253–264. - PubMed
-
- Han X, Gross RW. Anal Biochem. 2001;295:88–100. - PubMed
-
- Han X, Yang J, Cheng H, Ye H, Gross RW. Anal Biochem. 2004;330:317–331. - PubMed
-
- Han X, Yang K, Yang J, Fikes KN, Cheng H, Gross RW. J Am Soc Mass Spectrom. 2006;17:264–274. - PubMed
Publication types
MeSH terms
Substances
Grants and funding
LinkOut - more resources
Full Text Sources
Other Literature Sources

