. 2009 Apr 30;62(2):191-8.
doi: 10.1016/j.neuron.2009.03.011.

Millisecond-timescale optical control of neural dynamics in the nonhuman primate brain

Affiliations

Millisecond-timescale optical control of neural dynamics in the nonhuman primate brain

Xue Han et al. Neuron. .

Abstract

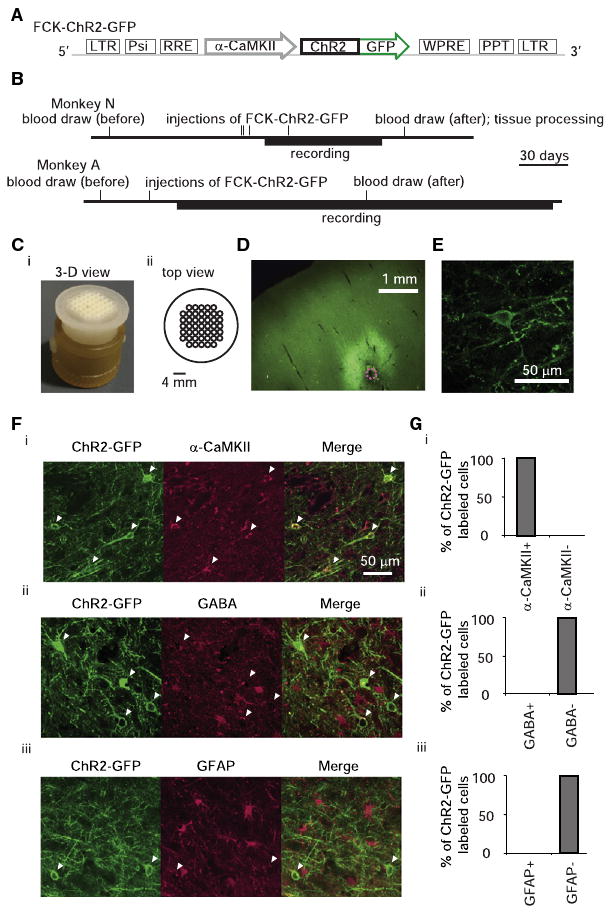
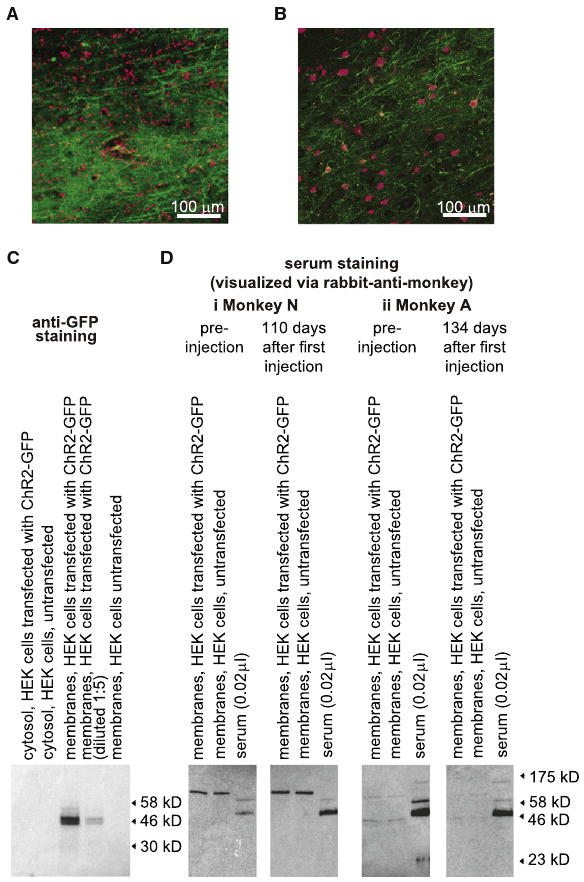
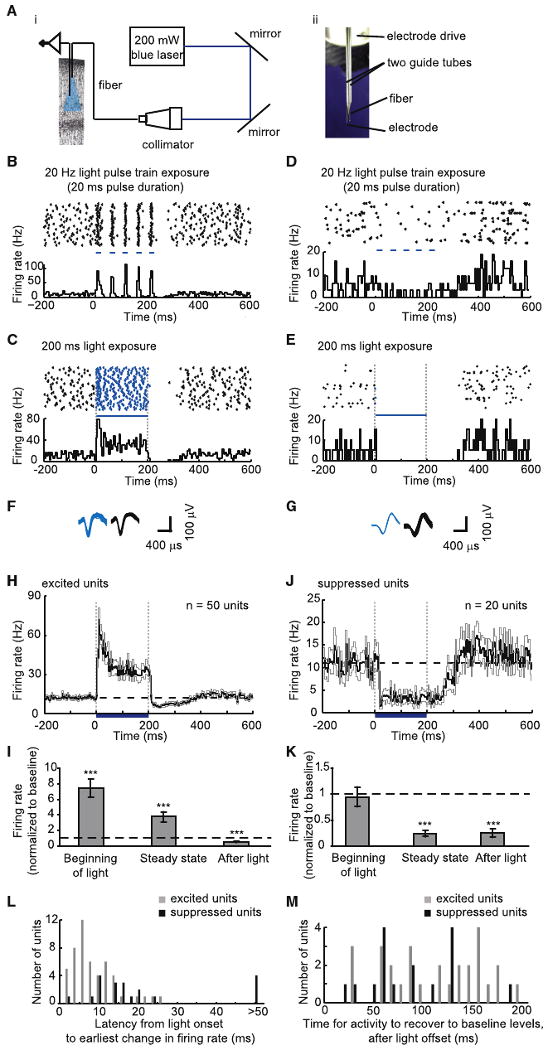
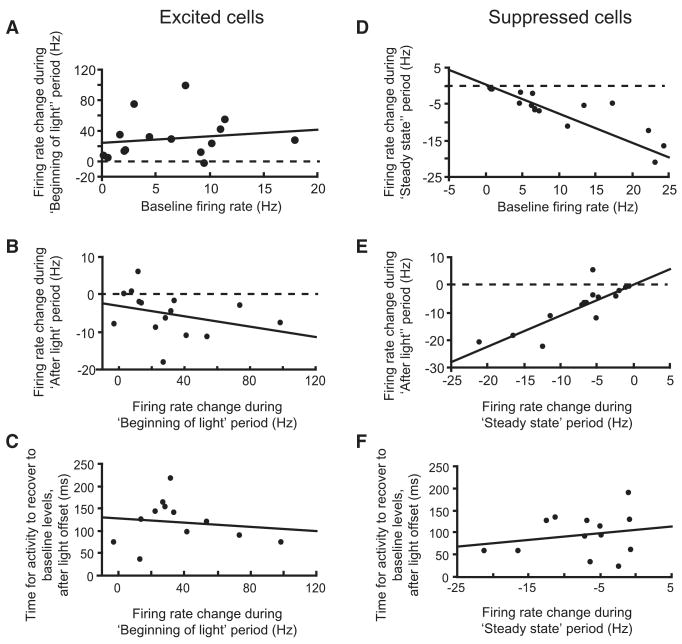
To understand how brain states and behaviors are generated by neural circuits, it would be useful to be able to perturb precisely the activity of specific cell types and pathways in the nonhuman primate nervous system. We used lentivirus to target the light-activated cation channel channelrhodopsin-2 (ChR2) specifically to excitatory neurons of the macaque frontal cortex. Using a laser-coupled optical fiber in conjunction with a recording microelectrode, we showed that activation of excitatory neurons resulted in well-timed excitatory and suppressive influences on neocortical neural networks. ChR2 was safely expressed, and could mediate optical neuromodulation, in primate neocortex over many months. These findings highlight a methodology for investigating the causal role of specific cell types in nonhuman primate neural computation, cognition, and behavior, and open up the possibility of a new generation of ultraprecise neurological and psychiatric therapeutics via cell-type-specific optical neural control prosthetics.


Figures

Figure 1
Figure 1. Expression of ChR2-GFP in Excitatory Neurons in Frontal Cortex of Primate Brain
(A) Schematic of lentiviral cassette. (B) Timeline of experiments for monkey N (top) and monkey A (bottom). (C) 3D printed targeting grid, inserted into a recording chamber (Ci) and in a top-view schematic (Cii). (D) Fluorescence image showing ChR2-GFP expression in deep layers of cortex (coronal slice; dotted magenta circle indicates diameter of virus injection cannula). (E) Representative cortical neuron expressing ChR2-GFP. (F) Images of anti-GFP fluorescence (left) as well as immunofluorescence of three cell-type markers: α-CaMKII (Fi), GABA (Fii), and GFAP (Fiii) (middle; right, overlay of the two left images). Arrowheads indicate ChR2-GFP-positive cell bodies. (G) Percent of ChR2-GFP-positive cells coexpressing each of the three markers in (F).
Figure 2
Figure 2. Analyses of Potential Immune Responses against ChR2-GFP-Expressing Neurons in Primate Cortex
(A) Nuclear DNA staining (red; To-Pro-3 stain) of slices of monkey cortex containing ChR2-GFP-expressing neurons (green). (B) Neuronal staining (red; NeuN antibody) of slices of monkey cortex containing ChR2-GFP-expressing neurons (green). (C) Validation of ChR2-GFP expression in HEK cells via western blotting, using anti-GFP antibody. From left to right, lanes show, immunostained with anti-GFP: cytosolic fraction of HEK cells transfected with ChR2-GFP plasmid, cytosolic fraction of untransfected HEK cells, membrane fraction of HEK cells transfected with ChR2-GFP plasmid, membrane fraction (diluted 1:5) of HEK cells transfected with ChR2-GFP plasmid, and membrane fractions of untransfected HEK cells. (D) Assessment of monkey serum reaction to ChR2-GFP, for monkey N (Di) and monkey A (Dii), via western blotting, comparing preinjection (left) to postinjection (right). Membrane fractions of HEK cells transfected with ChR2-GFP (left lane), membrane fractions of untransfected HEK cells (middle lane), and monkey serum samples (right lane) were incubated with monkey serum (1:50 dilution), followed by rabbit-anti-monkey secondary antibody for visualization.
Figure 3
Figure 3. Increases and Decreases in Neural Activity Resulting from Optical Stimulation of Excitatory Neurons
(A) Apparatus for optical activation and electrical recording. (Ai) Schematic. (Aii) Photograph, showing optical fiber (200 μm diameter) and electrode (200 μm shank diameter) in guide tubes. (B and C) Increases in spiking activity in one neuron during blue light illumination (five pulses, 20 ms duration each [B], and 1 pulse, 200 ms duration [C]). In each panel, shown at top is a spike raster plot displaying each spike as a black dot; 40 trials are shown in horizontal rows (in this and subsequent raster plots); shown at bottom is a histogram of instantaneous firing rate, averaged across all trials; bin size, 5 ms (in this and subsequent histogram plots). Periods of blue light illumination are indicated by horizontal blue dashes, in this and subsequent panels. (D and E) Decreases in spiking activity in one neuron during blue light illumination (five pulses, 20 ms duration (D), and one pulse, 200 ms duration [E]). As with (B) and (C), shown at top are spike raster plots and shown at bottom are histograms of instantaneous firing rate. (F and G) Action potential waveforms elicited during light (shown in blue, left) or occurring spontaneously in darkness (shown in black, right), for the neurons plotted in (C) and (E), respectively. (H) Instantaneous firing rate, averaged across all excited units recorded upon 200 ms blue light exposure (black line, mean; gray lines, mean ± SE; n = 50 units). (I) Relative firing rate (i.e., firing rate during the indicated period, divided by baseline firing rate) during the first 20 ms after light onset (“beginning of light”), during the period between 20 ms after light onset and 20 ms after light cessation (“steady state”), and during the 20 ms period starting 20 ms after light cessation (“after light”), for the n = 50 units shown in (H). (***), significantly different (p < 0.0001; paired t test) from baseline rate (shown as dotted line); plotted is mean ± SE. (J) Instantaneous firing rate averaged across all suppressed units upon 200 ms blue light exposure (black line, mean; gray lines, mean ± SE; n = 20 units). (K) Relative firing rate, during the beginning of light, steady state, and after light periods, for the n = 20 units shown in (J). (L) Histogram of latencies between light onset and the earliest change in firing rate, for excited units (gray bars, n = 50 units) and suppressed units (black bars, n = 20 units); latencies longer than 50 ms were plotted in a bin labeled “>50.” (M) Histogram of time elapsed until activity recovery to baseline after light cessation, for excited (gray bars, n = 28 units) and suppressed (black bars, n = 16 units) units that had lower-than-baseline firing rates during the after light period.
Figure 4
Figure 4. Comparison of Neural Activity Levels within Excited and Suppressed Single Units, before, during, and after Light Exposure
(A) Firing rate change during the beginning of light period (i.e., firing rate during beginning of light minus baseline firing rate) versus baseline firing rate, for excited cells (n = 15 excited single units). (B) Firing rate change during the after light period versus during the beginning of light period, for excited single units. (C) Time elapsed until activity recovery to baseline level after light cessation, versus firing rate change during the beginning of light period, for excited single units. (D) Firing rate change during the steady state period, versus baseline firing rate, for suppressed cells (n=16 suppressed single units). (E) Firing rate change during the after light period versus during the steady state period, for suppressed single units. (F) Time elapsed until activity recovery to baseline level after light cessation, versus firing rate change during the steady state period, for suppressed single units.

Comment in

References

    1. Bekkers JM. Distribution of slow AHP channels on hippocampal CA1 pyramidal neurons. J Neurophysiol. 2000;83:1756–1759. - PubMed
    1. Bernstein JG, Han X, Henninger MA, Ko EY, Qian X, Franzesi GT, McConnell JP, Stern P, Desimone R, Boyden ES. Prosthetic systems for therapeutic optical activation and silencing of genetically-targeted neurons. Proc Soc Photo Opt Instrum Eng. 2008;6854:68540H. - PMC - PubMed
    1. Boyden ES, Zhang F, Bamberg E, Nagel G, Deisseroth K. Millisecond-timescale, genetically targeted optical control of neural activity. Nat Neurosci. 2005;8:1263–1268. - PubMed
    1. Butovas S, Schwarz C. Spatiotemporal effects of microstimulation in rat neocortex: a parametric study using multielectrode recordings. J Neurophysiol. 2003;90:3024–3039. - PubMed
    1. Butovas S, Hormuzdi SG, Monyer H, Schwarz C. Effects of electrically coupled inhibitory networks on local neuronal responses to intra-cortical microstimulation. J Neurophysiol. 2006;96:1227–1236. - PubMed

Publication types

MeSH terms