. 2009 Apr 30;62(2):218-29.
doi: 10.1016/j.neuron.2009.01.033.

Interplay between cytosolic dopamine, calcium, and alpha-synuclein causes selective death of substantia nigra neurons

Affiliations

Interplay between cytosolic dopamine, calcium, and alpha-synuclein causes selective death of substantia nigra neurons

Eugene V Mosharov et al. Neuron. .

Abstract

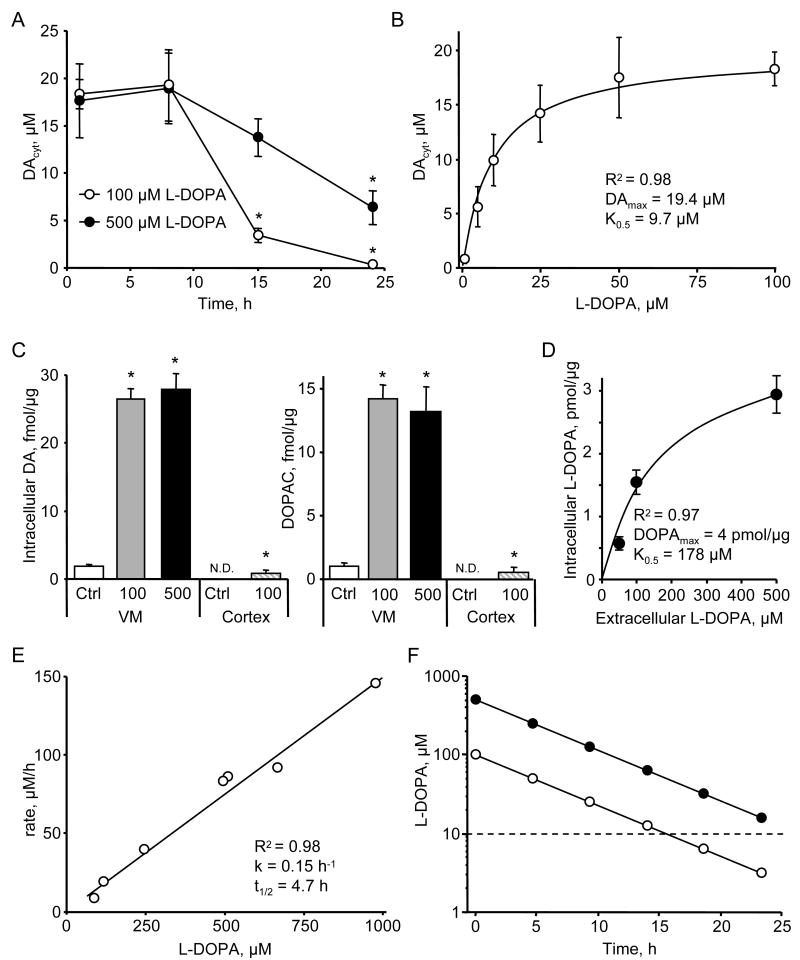
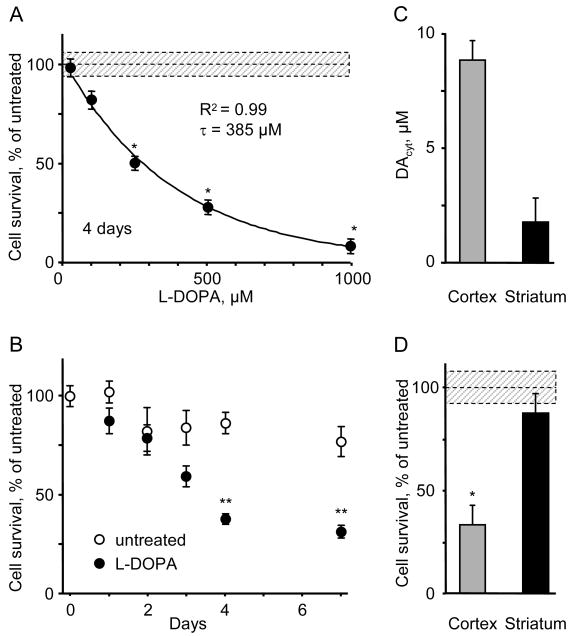
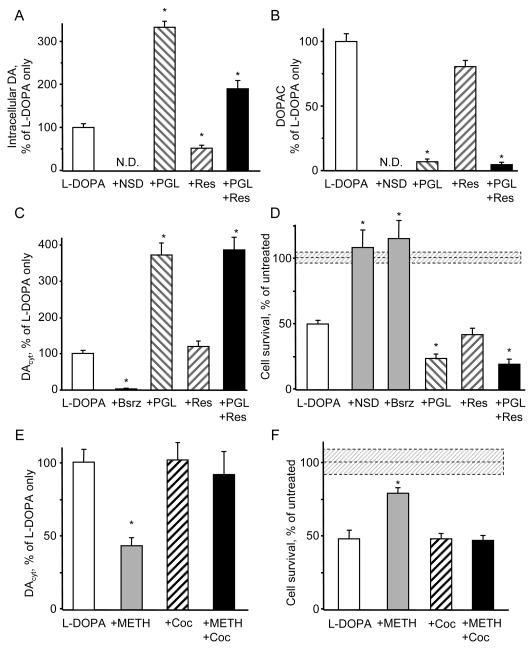
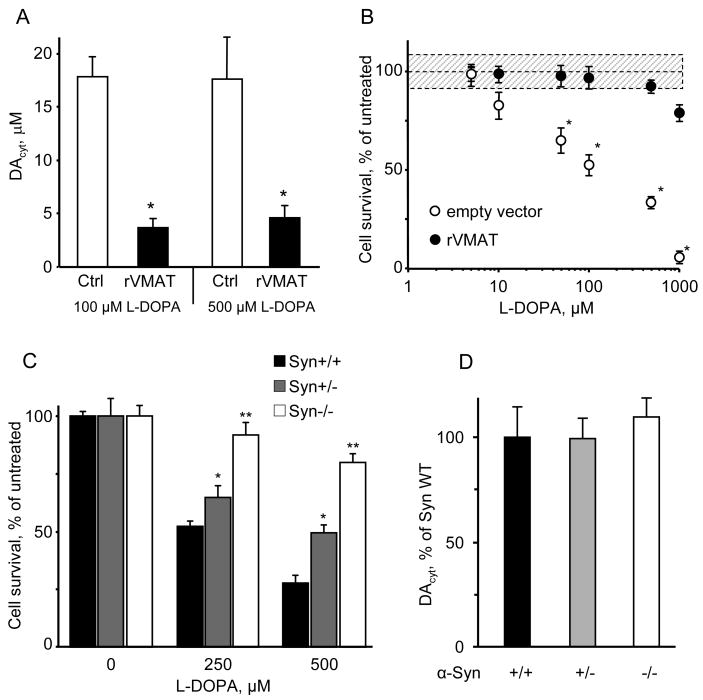
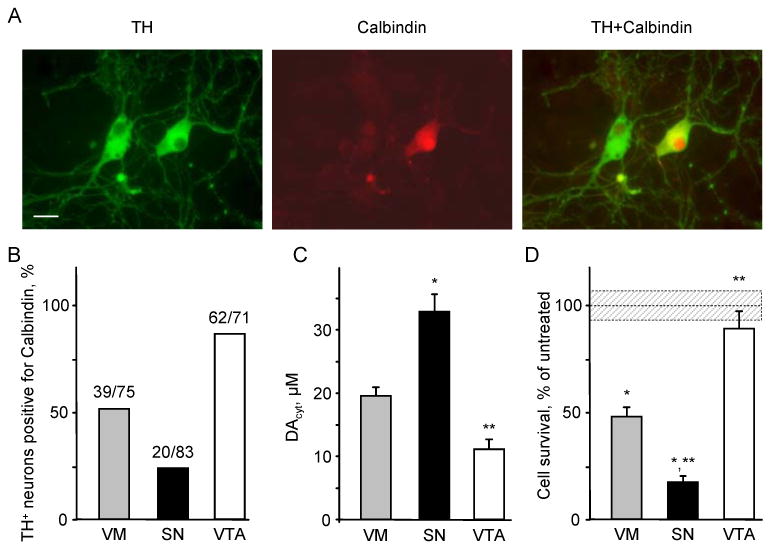
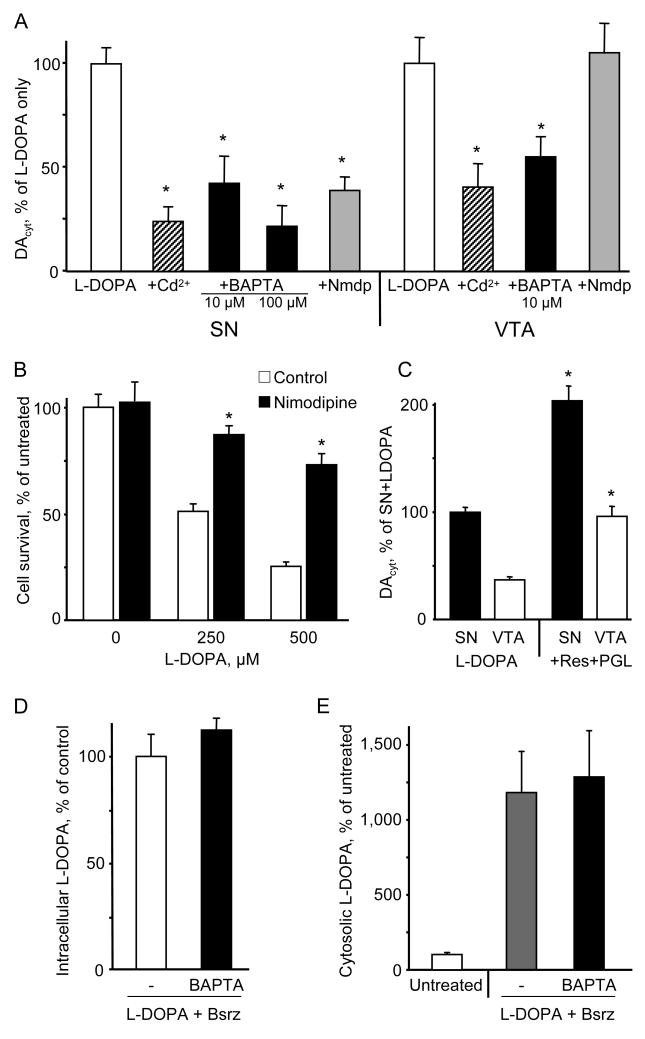
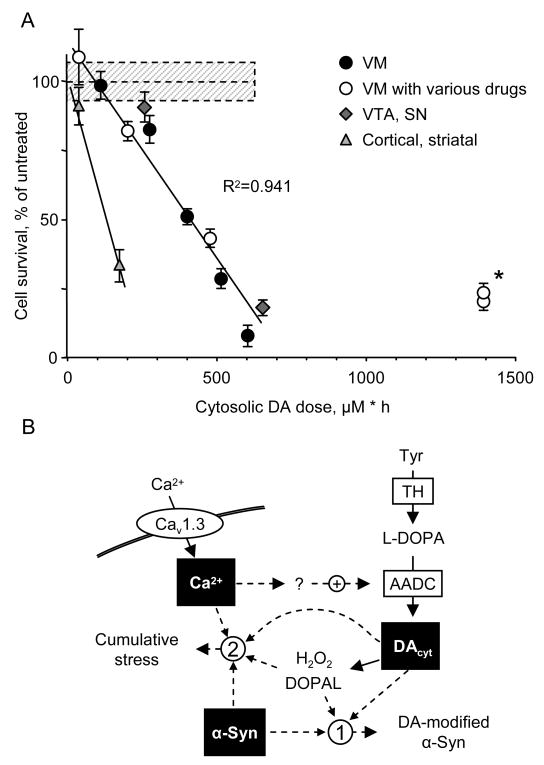
The basis for selective death of specific neuronal populations in neurodegenerative diseases remains unclear. Parkinson's disease (PD) is a synucleinopathy characterized by a preferential loss of dopaminergic neurons in the substantia nigra (SN), whereas neurons of the ventral tegmental area (VTA) are spared. Using intracellular patch electrochemistry to directly measure cytosolic dopamine (DA(cyt)) in cultured midbrain neurons, we confirm that elevated DA(cyt) and its metabolites are neurotoxic and that genetic and pharmacological interventions that decrease DA(cyt) provide neuroprotection. L-DOPA increased DA(cyt) in SN neurons to levels 2- to 3-fold higher than in VTA neurons, a response dependent on dihydropyridine-sensitive Ca2+ channels, resulting in greater susceptibility of SN neurons to L-DOPA-induced neurotoxicity. DA(cyt) was not altered by alpha-synuclein deletion, although dopaminergic neurons lacking alpha-synuclein were resistant to L-DOPA-induced cell death. Thus, an interaction between Ca2+, DA(cyt), and alpha-synuclein may underlie the susceptibility of SN neurons in PD, suggesting multiple therapeutic targets.


Figures

Figure 1
Figure 1. L-DOPA metabolic consumption by VM neurons
(A) Time dependence of DAcyt following cell treatment with two L-DOPA concentrations. * - p<0.05 vs. 1h time-point by one-way ANOVA (n = 9-52 cells in different groups). (B) Dependence of DAcyt on extracellular L-DOPA in mouse neurons treated with the drug for 1h (n = 10-24 cells). Solid line indicates the fit of the data-points using the equation: [DAcyt] = DAmax * [L-DOPA] / (K0.5 + [L-DOPA]). (C) HPLC-EC measurements of the total intracellular DA and DOPAC in rat VM (n = 9 dishes) and cortical (n = 3) neuronal cultures exposed to 100 or 500 μM L-DOPA for 1h; N.D. is ‘not detected’. * - p<0.05 vs. untreated cultures. (D) HPLC measurements of intracellular L-DOPA contents in rat VM cultures pretreated with AADC inhibitor benserazide (2 μM; 1 h) and then treated with 50, 100 or 500 μM L-DOPA for 1h (n = 3-8 dishes). Solid line indicates the fit of the data-points using the equation: [L-DOPAintracell] = DOPAmax * [L-DOPAextracell] / (K0.5 + [L-DOPAextracell]). (E) Dependence of the rate of L-DOPA auto-oxidation on the initial L-DOPA concentration determined by HPLC-EC in cell-free system. The half-life was calculated from the incline (k) of the linear fit of the data-points as t1/2 = Ln(2)/k. (F) Time dependence of extracellular L-DOPA concentration modeled using kinetic constants from (E). Dashed line indicates K0.5 from (B). Data on panels A-D are means ± SEM.
Figure 2
Figure 2. L-DOPA-induced neurotoxicity in DA and non-DA neurons
(A) The loss of TH+ neurons in mouse VM cultures treated with different L-DOPA concentrations for 4 days. Similar decline in the number of VMAT2-positive neurons was observed (data not shown). The average number and the density of TH+ neurons in untreated cultures were 200-250 neurons/culture and 10-15 neurons/mm2, correspondingly. Solid line is the fit of the data with an exponential decay function. * - p<0.001 vs. age-matched controls by one-way ANOVA. (B) Time-dependence of DA neurons survival in cultures treated with 250 μM L-DOPA. ** - p<0.001 vs. untreated cells by two-way ANOVA (n = 3-4 dishes). (C) DAcyt in mouse cortical (n = 59) and striatal (n = 21) neurons incubated with 100 μM L-DOPA for 1h. (D) L-DOPA-induced toxicity in cortical and striatal neurons exposed to 250 μM for 4 days and immunostained for MAP2. * - p<0.01 vs. untreated cells by t-test (n = 3-5 dishes). Dotted line and shadowed box on (A) and (D) represent mean ± SEM in untreated cells.
Figure 3
Figure 3. Effect of pharmacological inhibitors on DAcyt and neurotoxicity
(A,B) HPLC-EC measurements of total intracellular DA (A) and DOPAC (B) in rat VM neuronal cultures pretreated for 1h with 500 μM NSD-1015, 2 μM reserpine (res) or 10 μM pargyline (PGL) and then treated with 100 μM L-DOPA for 1h (n = 6-10 dishes). N.D. - ‘not detected’. (C) DAcyt in mouse VM neurons under the same treatments as above accepts 2 μM benserazide (Bsrz) to block AADC. n = 22-81 cells. (D) The effect of NSD-1015, benserazide, reserpine and pargyline on the survival of mouse TH+ neurons treated with 250 μM L-DOPA for 4 days (n = 6-20 dishes). (E) DAcyt concentration in TH-GFP neurons pre-treated with 10 μM cocaine for 15 min, then exposed to 100 μM L-DOPA for 1 h, and then treated with 50 μM METH for 15-30 min (n = 19-46 cells). (F) Cell survival of mouse TH+ neurons pre-treated with METH and cocaine as in (E) and exposed to 250 μM L-DOPA for 4 days (n = 3-8 dishes). * - p<0.05 vs. cells treated with L-DOPA only by one-way ANOVA. Dotted lines and shadowed boxes on (D) and (F) represent mean ± SEM in untreated cells.
Figure 4
Figure 4. Effect of VMAT2 overexpression and α-syn knock-out on DAcyt and toxicity
(A) DAcyt in sister cultures of mouse TH+ neurons treated with L-DOPA for 1h; cells were either untransfected or were transfected with rVMAT2 or empty vector (not shown) one day before the application of L-DOPA. * - p<0.01 vs. cells treated with L-DOPA only by one-way ANOVA (N=15-28 cells). (B) Neuroprotection of TH+ neuron in rat VM cultures infected with rVMAT2 or empty vector and exposed to varying concentrations of L-DOPA on day one and accessed for survival on day 7. * - p<0.05 vs. by two-way ANOVA. (C) Reduced sensitivity of TH+ neurons from α-syn deficient mice to L-DOPA-induced neurotoxicity. Neurons from α-syn wild-type, heterozygous and knock-out littermate mice were treated with indicated L-DOPA concentrations for 4 days. * - p<0.05 and ** - p<0.001 vs. the WT by two-way ANOVA with Bonferroni post-hoc test (n = 10-29 dishes). (D) Comparison of DAcyt levels in neurons from α syn knock-out, heterozygous and wild-type mice treated with 100 μM L-DOPA treated for 1 h (n = 20-49 cells).
Figure 5
Figure 5. Sensitivity of SN and VTA DA neurons to L-DOPA challenge
(A) Representative images of VM neuronal cultures double stained for TH and calbindin. Scale bar is 20 μm. (B) Relative number of calbindin+ cells within the population of TH+ neurons. (C) Cytosolic DA concentrations in VM, SN and VTA TH+ neurons treated with 100 μM L-DOPA for 1h. A representative experiment shown was repeated 5 times with 9-16 cells in each group in each experiment. p < 0.01 vs. VM (*) or vs. VM and SN (**) by one-way ANOVA. (D) L-DOPA-induced neurotoxicity in cultures treated with 250 μM L-DOPA for 4 days. Dotted line and shadowed box represents mean ± SEM in untreated cells. p < 0.01 vs. untreated neurons of the same group (*) or vs. L-DOPA-treated neurons of all other groups (**) by one-way ANOVA (n = 10-15 dishes).
Figure 6
Figure 6. Regulation of DAcyt by cytoplasmic Ca2+
(A) DAcyt in SN and VTA neurons pretreated with 30 μM CdCl2, 10 or 100 μM BAPTA-AM, or 10 μM nimodipine (Nmdp) for 1h, and then exposed to 100 μM L-DOPA for 1h. Data are presented as relative changes compared to SN and VTA neurons treated with L-DOPA only. * - p<0.05 vs. L-DOPA only by one-way ANOVA (n = 11-52 cells). (B) Protection of SN neurons from L-DOPA-induced neurotoxicity by L-type Ca2+ channel blocker nimodipine (10 μM; 1h pretreatment). * - p<0.05 vs. L-DOPA only by one-way ANOVA (n = 3-23 dishes). (C) DAcyt levels in SN and VTA neurons pretreated with 2 μM reserpine and 10 μM pargyline for 1h and then exposed to 100 μM L-DOPA for 1h. * - p<0.05 vs. corresponding L-DOPA only group by one-way ANOVA (n = 18-27 cells). (D) Whole-cell L-DOPA concentration in VM cultures pretreated for 1h with 2 μM benserazide with and without 10 μM BAPTA-AM and then exposed to 100 μM L-DOPA for 1h (n = 4 dishes). (E) Total cytosolic catechol concentrations (IPE in amperometric mode) in VM neurons either untreated or treated as in (D). n = 10 cells.
Figure 7
Figure 7. DAcyt dose and neurotoxicity
(A) Dependence of cell survival under L-DOPA-induced stress on the DAcyt dose in mouse neurons. DAcyt dose was estimated as [DAcyt] · TExposure = [DAcyt] · Ln ([L-DOPA] / K0.5) / k, where [DAcyt] is the concentration of cytosolic DA in cells treated with a saturating level (>50 μM) of L-DOPA for 1h, [L-DOPA] is the initial drug concentration, and K0.5 = 9.7 μM and k = 0.15 h-1 are the kinetic constants derived from Figure 1B and 1E, correspondingly. TExposure therefore approximates the time during which extracellular L-DOPA remained higher than K0.5 (Figure 1F). The datapoints are (from left to right): (filled circles) VM cultures treated with 25, 100, 250, 500 and 1000 μM L-DOPA alone; (open circles) VM neurons treated with 250 μM L-DOPA in the presence of benserazide, METH, reserpine, PGL and PGL+reserpine; (diamonds) VTA and SN neurons, and (triangles) striatal and cortical neurons treated with 250 μM L-DOPA. Dotted line and shadowed box represent mean ± SEM in untreated cells. Solid line is the linear fit of all datapoints, excluding striatal and cortical neurons, and two datapoints indicated by asterisk. Treatments to the right of this line are neuroprotective, as the same level of cell death is achieved with higher DAcyt doses; data points to the left of the line are more susceptible to DAcyt stress. (B) Multi-hit model of PD pathogenesis. Neurotoxicity is a result of multiple factors, including the presence of α-syn, elevation of cytoplasmic Ca2+ and the buildup of DAcyt and its metabolites. Non-exclusive toxic steps may result from (1) mechanisms that require direct interaction between DA or its metabolites with α-syn, such as DA-modified stabilization of α-syn protofibrils or inhibition of chaperone-mediated autophagy, or (2) cumulative damage from multiple independent sources. Decreasing the levels of any of the three players provides neuroprotection.

Comment in

References

    1. Abeliovich A, Schmitz Y, Farinas I, Choi-Lundberg D, Ho WH, Castillo PE, Shinsky N, Verdugo JM, Armanini M, Ryan A, et al. Mice lacking alpha-synuclein display functional deficits in the nigrostriatal dopamine system. Neuron. 2000;25:239–252. - PubMed
    1. Abou-Sleiman PM, Muqit MM, Wood NW. Expanding insights of mitochondrial dysfunction in Parkinson's disease. Nat Rev Neurosci. 2006;7:207–219. - PubMed
    1. Alvarez-Fischer D, Henze C, Strenzke C, Westrich J, Ferger B, Hoglinger GU, Oertel WH, Hartmann A. Characterization of the striatal 6-OHDA model of Parkinson's disease in wild type and alpha-synuclein-deleted mice. Exp Neurol. 2008;210:182–193. Epub 2007 Nov 2001. - PubMed
    1. Baroudi G, Qu Y, Ramadan O, Chahine M, Boutjdir M. Protein kinase C activation inhibits Cav1.3 calcium channel at NH2-terminal serine 81 phosphorylation site. Am J Physiol Heart Circ Physiol. 2006;291:H1614–1622. - PubMed
    1. Burke RE, Antonelli M, Sulzer D. Glial cell line-derived neurotrophic growth factor inhibits apoptotic death of postnatal substantia nigra dopamine neurons in primary culture. J Neurochem. 1998;71:517–525. - PubMed

Publication types

MeSH terms