. 2009 Apr 30;62(2):230-41.
doi: 10.1016/j.neuron.2009.03.015.

Synaptic and extrasynaptic factors governing glutamatergic retinal waves

Affiliations

Synaptic and extrasynaptic factors governing glutamatergic retinal waves

Aaron G Blankenship et al. Neuron. .

Abstract

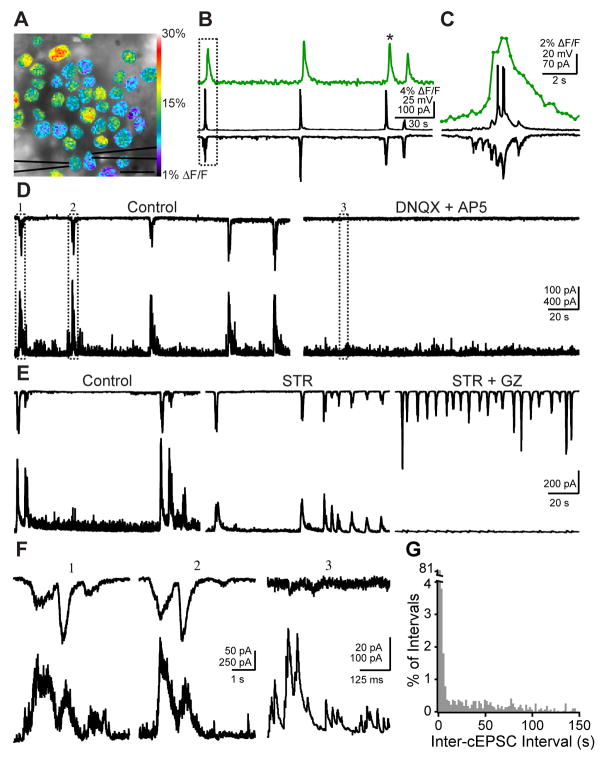
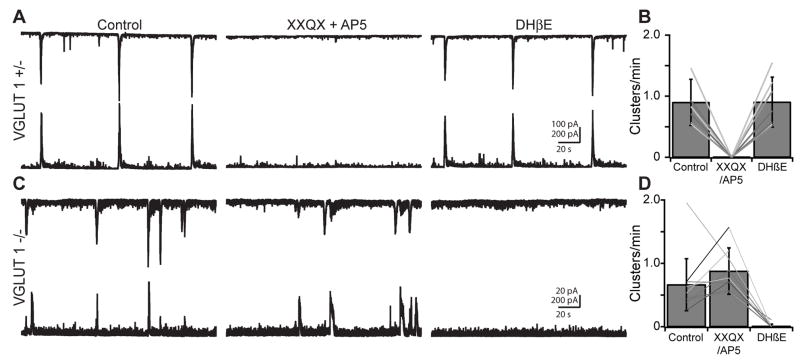
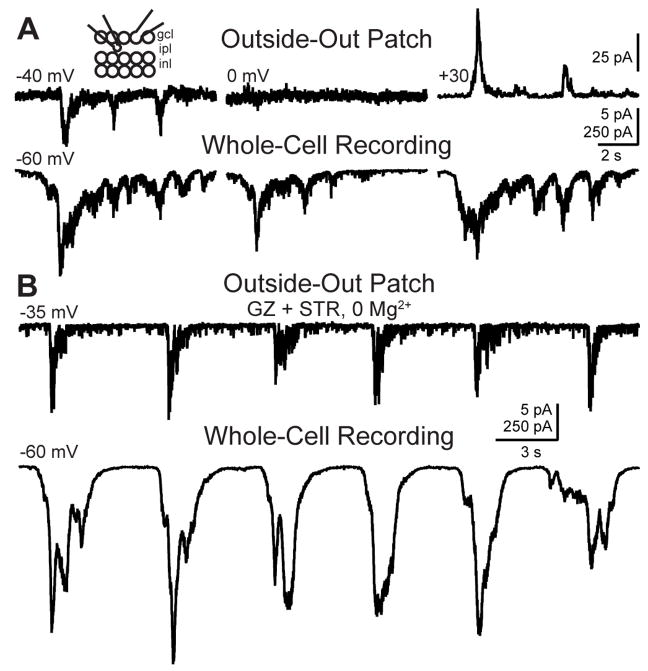
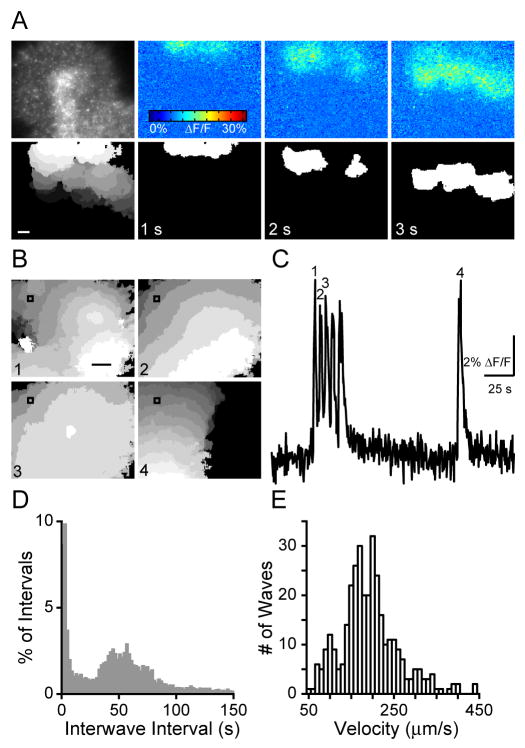
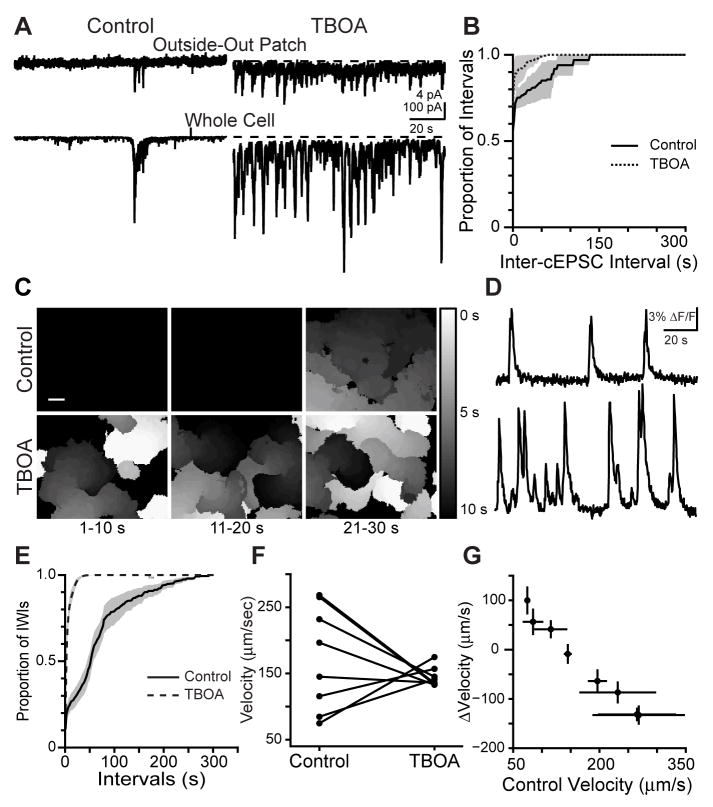
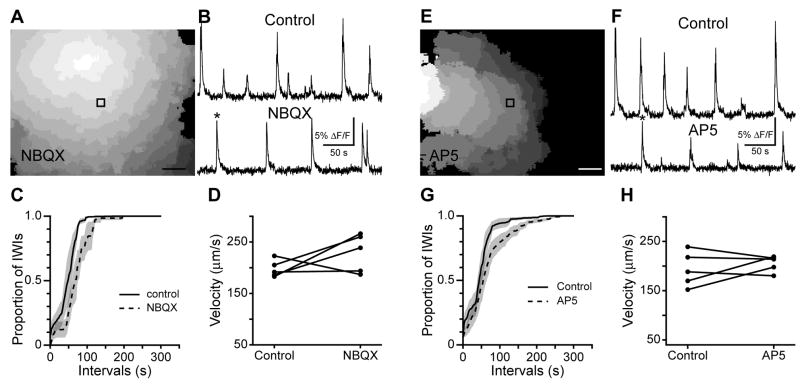
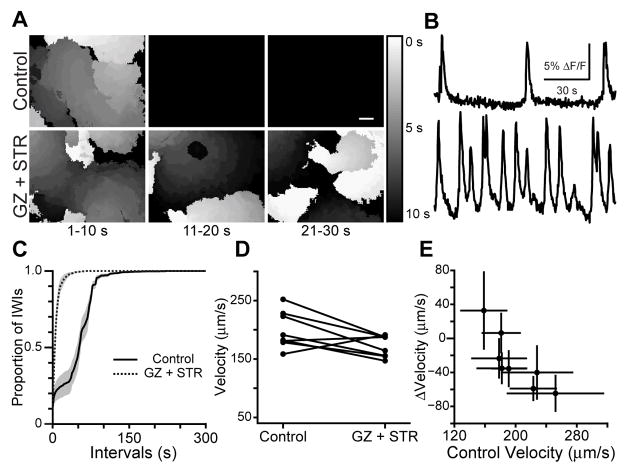
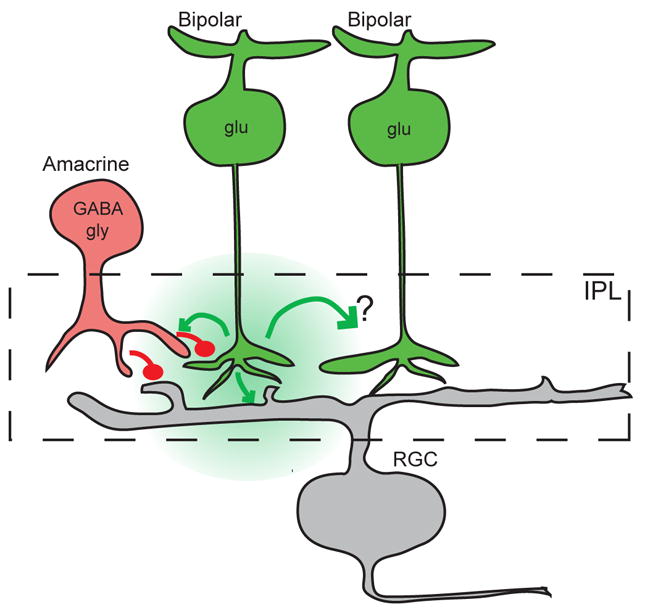
In the few days prior to eye-opening in mice, the excitatory drive underlying waves switches from cholinergic to glutamatergic. Here, we describe the unique synaptic and spatiotemporal properties of waves generated by the retina's glutamatergic circuits. First, knockout mice lacking vesicular glutamate transporter type 1 do not have glutamatergic waves, but continue to exhibit cholinergic waves, demonstrating that the two wave-generating circuits are linked. Second, simultaneous outside-out patch and whole-cell recordings reveal that retinal waves are accompanied by transient increases in extrasynaptic glutamate, directly demonstrating the existence of glutamate spillover during waves. Third, the initiation rate and propagation speed of retinal waves, as assayed by calcium imaging, are sensitive to pharmacological manipulations of spillover and inhibition, demonstrating a role for both signaling pathways in shaping the spatiotemporal properties of glutamatergic retinal waves.


Figures

Figure 1
Figure 1. Simultaneous calcium imaging and whole-cell recording show compound excitatory and inhibitory synaptic inputs are correlated with retinal waves
(A) Fluorescence image of retinal ganglion cell layer loaded with the calcium indicator OGB-1 AM using the multicell bolus loading technique. Pseudocolor overlay represents the fractional change in fluorescence over baseline (ΔF/F) in a single frame at the peak of a retinal wave (frame taken from the wave marked by an asterisk in B). Black triangles represent whole-cell patch clamp electrodes. Scale bar: 15 μm (B) Simultaneous calcium imaging (top), whole-cell current (middle) and voltage (bottom, Vm = −60mV) clamp traces recorded over 3 min. Time course of ΔF/F is averaged over the entire field of view. Vertical scale: 4% ΔF/F, 25mV, 100pA; Horizontal scale: 30 s. (C) Simultaneous calcium imaging (top), whole-cell current (middle) and voltage (bottom, Vm = −60 mV) clamp traces recorded during the wave in the boxed region of B. Dots on calcium imaging trace represent the average fluorescence intensity at each time point, with no filtering. Vertical scale: 2% ΔF/F, 20mV, 70pA; Horizontal scale: 2 s. (D) Left, whole-cell voltage clamp recordings from two neighboring RGCs reveal that RGCs receive both excitatory (−60 mV, top) and inhibitory (0 mV, bottom) compound synaptic inputs (cEPSCs and cIPSCs) during retinal waves. Recording is 3 min long. Right, Whole-cell voltage clamp recordings from the same pair as in left panel, in the presence of 20 μM DNQX and 50 μM AP5. Recording is 3 min long. Numbered boxes represent events expanded in F. Vertical scale bar: 100 pA for top trace, 500 pA for bottom trace; Horizontal scale bar: 30 s. (E) Dual whole-cell voltage clamp recording of wave-associated cEPSCs (top; Vm = −60 mV) and cIPSCs (bottom; Vm = 0mV) in control (left), in 4 μM strychnine (middle), and in the presence of 5 μM gabazine and 4 μM strychnine (right). Recordings in each condition are 2.5 minutes long. Vertical scale bar: 200 pA; Horizontal scale bar: 20 s. (F) Expanded timescale of the boxed areas in D. Top: −60 mV; Bottom: 0 mV. Small currents in top trace of (3) are unclamped IPSCs. Scale bar for (1) and (2): Vertical: 50 pA for top traces, 250 pA for bottom traces; Horizontal: 1 s. Scale bar for (3): Vertical: 20 pA for top trace, 100 pA for bottom trace; Horizontal: 125 ms (G) Histogram of intervals between peaks of wave-associated cEPSCs. Bin size is 2 s. n = 2,654 intervals from 46 cells.
Figure 2
Figure 2. VGLUT 1 −/− mice lack Stage III glutamate retinal waves but exhibit extended Stage II cholinergic waves
(A) Dual whole-cell voltage clamp recordings from neighboring RGCs in a P11 VGLUT 1 +/− retina. Wave-associated cEPSCs (top, Vm = −60 mV) and cIPSCs (bottom, Vm = 0 mV) are shown in control (left), in the presence of the glutamate receptor antagonists DNQX (20 μM) or NBQX (20 μM) and D-AP5 (50 μM, middle), and in the presence of the nicotinic acetylcholine receptor antagonist DHβE (8 μM, right). Recordings are 3 min long. n=10 cells in 5 mice for XXQX and AP5, n=11 cells in 5 mice for DHβE. XXQX = DNQX or NBQX. Vertical scale bar: 100 pA for top traces, 200 pA for bottom traces; Horizontal scale bar: 20 s. (B) Effects of ionotropic glutamate and nicotinic acetylcholine receptor antagonists on frequency of cEPSC clusters in VGLUT1 +/−. Bars are mean±SD, lines are individual cells. (C) Same experiment as in A in a P12 VGLUT1 −/− retina. Recordings are 3 min long. n=13 cells in 4 mice for XXQX and AP5, n=12 cells in 4 mice for DHβE. XXQX = DNQX or NBQX. Vertical scale bar: 100 pA for top traces, 200 pA for bottom traces; Horizontal scale bar: 20 s. (D) Effects of ionotropic glutamate and nicotinic acetylcholine receptor antagonists on frequency of cEPSC clusters in VGLUT1 −/−. Bars are mean±SD, lines are individual cells.
Figure 3
Figure 3. Glutamate spillover occurs during waves
(A) Simultaneous outside-out patch (top) and whole-cell (bottom) recordings from a single patch-RGC pair. RGC Vm = −60 mV; patch Vm = −40 mV (left), 0mV (middle) and +30 mV (right). Inset, schematic of recording configuration. Outside-out patch pipette was positioned in the IPL near the recorded RGC. Vertical scale bar: 5 pA for top left and middle traces, 25 pA for top right trace, 250 pA for bottom traces; Horizontal scale bar: 2 s. (B) Thirty-second-long voltage clamp recording from an outside-out patch (top, Vm = −35 mV) and RGC (bottom, Vm = −60 mV) in the presence of 5 μM gabazine (GZ), 4 μM strychnine (STR) and 0 Mg2+. Vertical scale bar: 5 pA for top trace, 250 pA for bottom trace; Horizontal scale bar: 3 s.
Figure 4
Figure 4. Calcium imaging reveals Stage III waves occur in episodic clusters
(A) Top Left frame is a fluorescence image showing loading of calcium indicator. Right frames are ΔF/F pseudocolor images during 3 seconds of a retinal wave. Bottom: Left frame, the spatial extent of propagation of a single wave. Each grayscale value represents the active area in one frame, with a 4 Hz frame rate. White is the first frame in which the wave was detected, dark gray the last. Right frames are binarized wave front (white; see Supplemental Experimental Procedures) showing progression of the same wave as in the top three frames. Scale: 100 μm. (B) Spatial extent of wave propagation of four waves marked by numbers in C. Colors are as in bottom left frame of A. (C) Time course of the ΔF/F recorded over 120 s from the 30×30 μm region of interest in B. Waves depicted in B are numbered. The first 5 waves follow within 3–5 seconds of one another. Conversely, the last wave is not followed rapidly by other waves. Vertical scale bar: 2% ΔF/F; Horizontal scale bar: 25 s. (D) Histogram of inter-wave intervals. Bin size is 2 s. n=22,204 IWIs from 69 retinas. (E) Histogram of wave velocities. Bin size is 10 s. n=341 waves from 34 retinas.
Figure 5
Figure 5. The effects of increased glutamate spillover on spatiotemporal properties of Stage III waves
(A) Outside-out patch recording (top; Vm = −40 mV) and RGC whole-cell voltage clamp recording of cEPSCs in an RGC (bottom, −60 mV) in control ACSF (left) and in 25 μM TBOA (right). Dotted line represents baseline holding current before TBOA application. Recordings are 2 min long. Vertical scale bar: top, 4 pA; bottom, 100pA. Horizontal scale bar: 20 s. (B) Cumulative histogram summarizing effects of TBOA on inter-cEPSC interval measured from whole-cell recordings. n=4 cells in control, n=3 cells in 25 μM TBOA, n=3 cells in rinse. Black is control, dotted line is TBOA. (C) Summary of spontaneous calcium transients during three sequential ten second intervals. Gray value corresponds to the time during which that region of the retina was active. Black is baseline; white is activity at 0 s, with increasing time depicted as darker grays. If a region of the retina was active more than once, the time of the most recent activity is displayed. Top: Control. Bottom: 25 μM TBOA. Scale bar = 100 μm (D) Time course of ΔF/F averaged over a 30 μm × 30 μm region in the center of the retina in C. Top: Control ACSF; Bottom: TBOA. (E) Summary cumulative probability distribution of inter-wave intervals (IWIs). Black line is control, dotted line is TBOA. Shaded areas represent standard error of the mean (n=9 retinas). (F) Summary of effects of TBOA on propagation speed. Individual dots represent single retinas; lines connect a retina’s speed in control and TBOA. (G) TBOA-induced change in wave propagation speed plotted versus propagation speed in control. Dots represent average speed of all waves in individual retinas; error bars are standard deviation.
Figure 6
Figure 6. Inter-wave interval, but not propagation speed, is affected by NMDA or AMPA/kainate receptor blockade
(A) Progression of a wave recorded with calcium imaging during bath application of 20 μM NBQX. Each grayscale value represents the active area in one frame, with a 4 Hz frame rate. White is the first frame in which the wave was detected, dark gray the last. Black square is the 30×30 μm region from which the traces in B are derived. Scale bar = 100 μm. (B) Time course of the ΔF/F in retinas in control (top) and during bath application of NBQX (bottom). Asterisk indicates the wave shown in A. Vertical scale bar: 5% ΔF/F; Horizontal scale bar: 50 s. (C) Cumulative probability distribution of inter-wave intervals (IWIs). Black line is control, dotted line is NBQX. Shaded areas represent standard error of the mean. (D) Summary of effects of NBQX on propagation speed. Individual dots represent single retinas; lines connect a retina’s speed in control and NBQX. (E) Progression of a wave recorded with calcium imaging during bath application of 50 μM AP5. Colors are as in A. Black square is the 30×30 μm region from which the traces in F are derived. Scale bar: 100 μm. (F) Time course of the ΔF/F in control (top) and during bath application of 50 μM AP5 (bottom). Asterisk indicates the wave shown in E. Vertical scale bar: 5% ΔF/F; Horizontal scale bar: 50 s. (G) Cumulative probability distribution of inter-wave intervals (IWIs). Black line is control, dotted line is AP5. Shaded areas represent standard error of the mean. (H) Summary of effects of AP5 on propagation speed. Individual dots represent single retinas; lines connect a retina’s speed in control and AP5.
Figure 7
Figure 7. Effects of blocking inhibition on the spatiotemporal properties of retinal waves
(A) Summary of spontaneous calcium transients during three sequential 10 second intervals. Gray value corresponds to the time during which that region of the retina was active. Black is baseline; white is activity at 0 s, with increasing time depicted as darker grays. If a region of the retina was active more than once, the time of the most recent activity is displayed. Top: Control. Bottom: 5 μM gabazine (GZ) and 4 μM strychnine (STR). Scale bar = 100 μm (B) Time course of ΔF/F averaged over a 30 μm × 30 μm region in the center of the retina in A. Top: Control. Bottom: gabazine and strychnine. (C) Summary cumulative probability distribution of inter-wave intervals (IWIs). Black line is control, dotted line is gabazine and strychnine. Shaded areas represent standard error of the mean. (D) Effects of gabazine and strychnine on propagation speed. Individual dots represent single retinas; lines connect a retina’s speed in control and GZ + STR. n=8 retinas. (E) GZ+STR-induced change in wave propagation speed plotted versus propagation speed in control. Dots represent average speed of all waves in individual retinas; error bars are standard deviation.
Figure 8
Figure 8. Schematic of functional circuit organization of mammalian retina during Stage III waves
Glutamatergic (glu) bipolar cells (green) provide excitatory input (green) to RGCs (gray) and amacrine cells (red). In turn, glycinergic (gly) and GABAergic (GABA) amacrine cells (here both represented by a generic red cell) provide direct inhibition (red) to RGCs as well as inhibit release from bipolar cells. The mechanism by which glutamate spillover (green cloud) depolarizes neighboring bipolar cells is unknown.

Similar articles

Cited by

References

    1. Allen TG. The ‘sniffer-patch’ technique for detection of neurotransmitter release. Trends Neurosci. 1997;20:192–197. - PubMed
    1. Allene C, Cattani A, Ackman JB, Bonifazi P, Aniksztejn L, Ben-Ari Y, Cossart R. Sequential generation of two distinct synapse-driven network patterns in developing neocortex. J Neurosci. 2008;28:12851–12863. - PMC - PubMed
    1. Balland B, Lachamp P, Kessler JP, Tell F. Silent synapses in developing rat nucleus tractus solitarii have AMPA receptors. J Neurosci. 2008;28:4624–4634. - PMC - PubMed
    1. Bansal A, Singer JH, Hwang BJ, Xu W, Beaudet A, Feller MB. Mice lacking specific nicotinic acetylcholine receptor subunits exhibit dramatically altered spontaneous activity patterns and reveal a limited role for retinal waves in forming ON and OFF circuits in the inner retina. J Neurosci. 2000;20:7672–7681. - PMC - PubMed
    1. Ben-Ari Y, Khalilov I, Represa A, Gozlan H. Interneurons set the tune of developing networks. Trends Neurosci. 2004;27:422–427. - PubMed

Publication types

MeSH terms

Substances

LinkOut - more resources