. 2009 Apr 30;62(2):269-80.
doi: 10.1016/j.neuron.2009.03.005.

The orbitofrontal cortex and ventral tegmental area are necessary for learning from unexpected outcomes

Affiliations

The orbitofrontal cortex and ventral tegmental area are necessary for learning from unexpected outcomes

Yuji K Takahashi et al. Neuron. .

Abstract

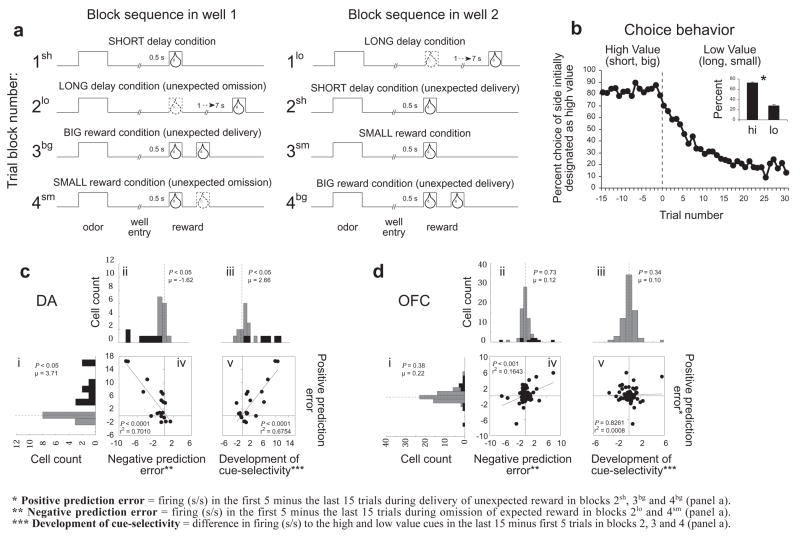
Humans and other animals change their behavior in response to unexpected outcomes. The orbitofrontal cortex (OFC) is implicated in such adaptive responding, based on evidence from reversal tasks. Yet these tasks confound using information about expected outcomes with learning when those expectations are violated. OFC is critical for the former function; here we show it is also critical for the latter. In a Pavlovian overexpectation task, inactivation of OFC prevented learning driven by unexpected outcomes, even when performance was assessed later. We propose this reflects a critical contribution of outcome signaling by OFC to encoding of reward prediction errors elsewhere. In accord with this proposal, we report that signaling of reward predictions by OFC neurons was related to signaling of prediction errors by dopamine neurons in ventral tegmental area (VTA). Furthermore, bilateral inactivation of VTA or contralateral inactivation of VTA and OFC disrupted learning driven by unexpected outcomes.


Figures

Figure 1
Figure 1. Effect of OFC inactivation on changes in behavior after over-expectation
Shown is the experimental timeline linking conditioning, compound conditioning, and probe phases to data from each phase. Top and bottom figures indicate control and OFCi group, respectively. In timeline and figures, V1 is a visual cue (a cue light), A1, A2, A3 are auditory cues (Tone, white noise, clicker, counterbalanced), and O1, O2 are different flavored sucrose pellets (banana and grape, counterbalanced). Position of cannulae within OFC in saline controls (gray dot) and OFCi (black dot) rats are shown in beneath the timeline. A. Percentage of responding to food cup during cue presentation across 10 days of conditioning. Gray, black, and while squares indicate A1, A2 and A3 cues, respectively. B. Percentage of responding to food cup during cue presentation across four days of compound training. Gray, black, and while squares indicate A1/V1, A2 and A3 cues, respectively. Gray and black bars in the insets indicate average normalized % responding to A1/V1 and A2, respectively. C. Percentage of responding to food cup during cue presentation in the probe test. Line graph shows responding across the eight trials and the bar graph shows average responding in these eight trials. Gray, black, and while colors indicate A1, A2 and A3 cues, respectively (*, significant difference at p<0.05; **, significant difference at p<0.01 or better).
Figure 2
Figure 2. Neural activity in response to errors in reward prediction in OFC versus VTA dopamine neurons
A. Line deflections indicate the time course of stimuli (odors and rewards) presented to the animal on each trial. Dashed lines show when reward is omitted and solid lines show when reward is delivered. At the start of each recording session one well was randomly designated as short (a 0.5 s delay before reward) and the other long (a 1–7 s delay before reward) (block 1). In the second block of trials these contingencies were switched (block 2). In blocks 3–4, we held the delay constant while manipulating the number of the rewards delivered. Expected rewards were thus omitted on long delay trials at the start of block 2 (2lo) and small reward conditions at the start of blocks 3 and 4 (3sm and 4 sm), and rewards were delivered unexpectedly on short delay trials and big reward trials at the start of blocks 2 (2sh) and block 3–4 (3bg and 4 bg), respectively. B. Line graphs show choice behavior before and after the switch from high valued outcome (averaged across short and big) to a low valued outcome (averaged across long and small); inset bar graphs show average percent choice for high vs low value outcomes. After 5 trials rats had switched their preference to the more valued side, choosing the preferred reward (i.e. short, big) greater than 50% of the time. By the last 15 trials in a block of trials rats were choosing the more valued well greater than 75% of the time. Notably, the change in choice behavior within a given block (first 5 minus last 15 trials) was not significantly different (2-factor anova) across recording group (OFC vs dopamine; P = 0.1435) or value manipulation (delay vs size; P = 0.2311). C and D. Changes in spiking activity during reward delivery and cue sampling in response to errors in reward prediction in reward-responsive VTA dopamine neurons (n = 20) versus reward-responsive OFC neurons (n = 69). Histograms plot the difference in the average firing rate of each neuron in the first five versus the last fifteen trials during the 500 ms after delivery of an unexpected reward (i) or omission of an expected reward (ii) or during the cue sampling period as value selectivity developed (iii). Black bars represent neurons in which the difference in firing was statistically significant (t-test; p < 0.05). P-values in the distribution histogram indicated the results of a wilcoxon text. Boxed scatter plots illustrate neuron-by-neuron correlations between signaling of positive prediction errors and negative prediction errors (iv) or between signaling of positive prediction errors and the development of cue selective responses (v).
Figure 3
Figure 3. Rats time reward delivery on small reward but not delayed reward trials
A. Line deflections indicate the time course of well entry and reward omission and delivery on delay and small reward trials (odor sampling precedes well entry but is not shown; see Figure 2A). Dashed lines show when reward is omitted (long-delay trials) and solid lines show when reward is delivered (delay and small reward trials). B. Licking aligned on omission (left) and delivery of reward (right) on delay (black) and small (gray) reward trials. Licking increased significantly before delivery of reward on small trials and before omission of reward on delay trials; licking did not change significantly prior to reward delivery on delay trials. C. Bars illustrating slope of rise in licking behavior during the 500 ms preceding reward omission and delivery on delay and small reward trials (*P < 0.0001; ttest). Error bars indicate SEM’s.
Figure 4
Figure 4. Encoding of expectancies and not prediction errors in OFC
A. Line deflections indicate the time course of well entry and reward omission and delivery on delay and small reward trials as in Figure 3A. B. Average firing of reward-responsive VTA dopamine neurons (n = 20) aligned on omission (left) and delivery of reward (right) on delay (black) and small (gray) reward trials. Firing in the dopamine neurons declined on reward omission and increased on reward delivery, and the increase was greater for delivery of the delayed-unpredictable reward. C–F. Histograms show the distribution of difference scores between firing in the epochs labeled under panel B. Epochs analyzed include [1] 500 ms before reward omission on delayed trials, [2] 500 ms during reward omission on delayed trials, [3] 500 ms before reward delivery on delayed trials, [4] 500 ms after reward delivery on small trials and [5]–[6] 500 ms before and after reward delivery on small reward trials, respectively. Black bars represent neurons in which the difference in firing was statistically significant (t-test; p < 0.05). P-values in the distribution histogram indicated the results of a wilcoxon text for each comparison.
Figure 5
Figure 5. Encoding of prediction errors and not expectancies in VTA
A–F.Conventions as in Figure 4 except data is from reward-responsive OFC neurons (n = 69). Firing in the OFC neurons increased before delivery of the small-predictable reward and also before omission of expected reward early in delay trials; firing did not increase before delivery of the delayed-unpredictable reward. Black bars represent neurons in which the difference in firing was statistically significant (t-test; p < 0.05). P-values in the distribution histogram indicated the results of a wilcoxon text for each comparison.
Figure 6
Figure 6. Effect of VTA inactivation on changes in behavior after over-expectation
Conventions as in Figure 1, except that data is from saline control and VTAi group or OFC-VTAi group. A. Percentage of responding to food cup during cue presentation across 10 days of conditioning. B. Percentage of responding to food cup during cue presentation across four days of compound training. C. Percentage of responding to food cup during cue presentation in the probe test. Line graph shows responding across the eight trials and the bar graph shows average responding in these eight trials.

References

    1. Arana FS, Parkinson JA, Hinton E, Holland AJ, Owen AM, Roberts AC. Dissociable contributions of the human amygdala and orbitofrontal cortex to incentive motivation and goal selection. Journal of Neuroscience. 2003;23:9632–9638. - PMC - PubMed
    1. Bayer HM, Glimcher PW. Midbrain dopamine neurons encode a quantitative reward prediction error signal. Neuron. 2005;47:129–141. - PMC - PubMed
    1. Brown VJ, McAlonan K. Orbital prefrontal cortex mediates reversal learning and not attentional set shifting in the rat. Behavioral Brain Research. 2003;146:97–130. - PubMed
    1. Burke KA, Franz TM, Miller DN, Schoenbaum G. The role of orbitofrontal cortex in the pursuit of happiness and more specific rewards. Nature. 2008;454:340–344. - PMC - PubMed
    1. Chudasama Y, Kralik JD, Murray EA. Rhesus monkeys with orbital prefrontal cortex lesions can learn to inhibit prepotent responses in the reversed reward contingency task. Cerebral Cortex. 2007;17:1154–1159. - PubMed

Publication types

MeSH terms

LinkOut - more resources