. 2009 Apr 30;62(2):291-303.
doi: 10.1016/j.neuron.2009.03.012.

State-dependent variability of neuronal responses to transcranial magnetic stimulation of the visual cortex

Affiliations

State-dependent variability of neuronal responses to transcranial magnetic stimulation of the visual cortex

Brian N Pasley et al. Neuron. .

Abstract

Electrical brain stimulation is a promising tool for both experimental and clinical applications. However, the effects of stimulation on neuronal activity are highly variable and poorly understood. To investigate the basis of this variability, we performed extracellular recordings in the visual cortex following application of transcranial magnetic stimulation (TMS). Our measurements of spiking and local field potential activity exhibit two types of response patterns which are characterized by the presence or absence of spontaneous discharge following stimulation. This variability can be partially explained by state-dependent effects, in which higher pre-TMS activity predicts larger post-TMS responses. These results reveal the possibility that variability in the neural response to TMS can be exploited to optimize the effects of stimulation. It is conceivable that this feature could be utilized in real time during the treatment of clinical disorders.


Figures

Figure 1
Figure 1. TMS coil position and experimental paradigm
A) Illustration of the two coil-electrode configurations. At 28 sites in 3 cats, the coil was positioned posterior to the visual cortex and angled towards the horizontal plane (left). Penetrations were made with a carbon fiber electrode at an angle of P45, M0. At 19 recording sites in 2 cats, the coil was positioned obliquely near the transverse plane, superior to the visual cortex (right). Penetrations were made with a dual tungsten array (inter-electrode spacing of ∼400 μm) at an angle of A45, M0. For both configurations, the midpoint of the coil was centered on the primary visual cortex craniotomy and was located between 1 and 2 cm from the skull. No significant differences between the neural responses to TMS were found for the different electrode-coil configurations (rank sum test, p > 0.2), thus these data were pooled in all analyses. B) Timeline of a single trial. A visual stimulus (high contrast drifting grating) was presented repeatedly for 2 s with an inter-stimulus interval of 8 s. After a baseline period (40 s), a short TMS pulse train (1– 4 s, 2 – 8 Hz, 100% stimulator intensity) was applied during an inter-stimulus interval. Single-unit and LFP data were collected during response recovery (typically 5-15 min). C) Peri-stimulus time histogram (PSTH) of spiking activity during a sample trial. Downward arrow at time zero denotes the application of a 4 Hz, 2s TMS pulse train. In this and all subsequent PSTHs the bin size is 0.5 s. D) Firing rate for the same trial as shown in (C), with activity separated into spontaneous and evoked components. The evoked response (dotted line) represents average activity during stimulus presentations, while the spontaneous component (solid line) indicates activity that occurred between stimuli.
Figure 2
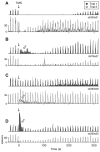
Figure 2. Examples of variability in TMS responses
A-D) PSTHs of two sample trials with identical TMS parameters for 4 different cells. Downward solid arrows denote application of the TMS pulse train. Open arrows signify substantial spontaneous discharge following TMS. The stimulation parameters used in each example are as follows: (A) 4 Hz, 2s; (B) 8 Hz, 4 s; (C) 4 Hz, 4 s; and (D) 4 Hz, 2 s. Evoked response components within single cells are more similar than those between cells. For example, some neurons reliably show moderate (D) or strong (B) reduction of evoked spiking following a TMS pulse train, while others consistently exhibit little alteration in stimulus evoked activity (C). In contrast, spontaneous responses are extremely variable across identical trials within the same cell. In many instances (B-D), neurons display substantial spontaneous discharge on one trial, but a complete absence of spontaneous firing on another.
Figure 3
Figure 3. Trend in spontaneous response to TMS over time
A) PSTHs of 7 consecutive trials from a single cell. A 4 Hz, 2s TMS pulse train (downward arrow) was applied in each trial. PSTHs are truncated at 2 minutes to highlight spontaneous activity in the first 60 seconds following TMS (shaded area). Colors in panels (A) and (B) represent trial number. B) Scatterplot of trial number versus the change in spontaneous firing rate (ΔRs) for the set of trials shown in (A). ΔRs is calculated as the difference between the average spike rate in the first minute following TMS and the average value during the baseline period. Dashed line indicates the least-squares fit to the data. C) Scatterplot of normalized trial number versus normalized ΔRs for 23 sets of data (n = 112 total trials). For each set of data, the values for ΔRs and trial number were transformed into their respective ranks then normalized by subtracting the mean rank. Symbols of different sizes are used to indicate the number of the trials at the same rank coordinates. Trial number and the spontaneous response exhibit a weak negative correlation (r = -0.26, p <0.01, t test). No relationship is found between trial number and the evoked response (r = 0.07, p = 0.46, t test).
Figure 4
Figure 4. Distributions of inter-spike intervals (ISIs) before and after TMS
A) Log ISI histograms of B trials (left) and NB trials (right) were constructed from spontaneous spikes (spikes occurring between presentation of visual stimuli) in 30 s windows. Each histogram spans from 0.4 ms to 8 s in 90 logarithmically spaced bins. Histograms are displayed for the 30 s prior to TMS (top), the 30 s immediately following TMS (middle) and a 30 s window occurring roughly 5 minutes after TMS. For all time periods, the histograms exhibit two separate ISI peaks, the locations of which are estimated by fitting a mixture of Gaussians. Superimposed over the histograms are the best-fit Gaussians for short (dark grey) and long (light grey) ISI peaks. B) Locations of ISI peaks at short (squares) and long (circles) intervals for all time periods. Open symbols designate data for B trials, while filled symbols represent NB trials. Error bars indicate 95% confidence intervals, as estimated with a bootstrap resampling procedure (n = 1000 resamples) (Efron and Tibshirani, 1994).
Figure 5
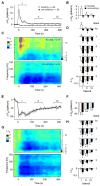
Figure 5. Response time courses for bursting (B) and non-bursting (NB) response patterns
A) Average time courses of the change in spontaneous spiking activity from baseline (ΔRs) for B (open symbols) and NB trials (filled symbols). Error bars signify ±1 s.e.m. B) Average changes in ΔRs for time intervals I, II, and III, as denoted in panel (A). Intervals I, II, and III correspond roughly to the first, third and fifth minute following TMS, respectively. Asterisks indicate a significant difference from baseline values (p<0.05, sign-rank test, corrected). C) Spectrograms showing the change in spontaneous LFP power (ΔLs) for B (top) and NB (bottom) trials. At each time point, ΔLs is calculated as a log ratio relative to the baseline spontaneous LFP power. Trials were classified as B or NB based on the activity of the single-unit recorded at the same site. In these and subsequent spectrograms, data are color-mapped symmetrically around zero such that positive values appear as warm colors, negative values appear as cool colors, and zero maps to green. D) Average changes in ΔLs for time intervals I, II, and III as a function of different frequency bands. LFP bands, notated in panel (C), are defined as follows: Δ (delta; 1-4 Hz), θ (theta; 4-8 Hz), α (alpha; 8-12 Hz), β (beta; 12-20 Hz), γ (gamma; 20-80 Hz), hγ (high gamma; 80-150 Hz). E-H) Average time courses of changes in evoked spiking (E, F) and evoked LFP power (G, H), displayed in the same format as (A-D). Note that in (E), spontaneous activity directly preceding the presentation of a visual stimulus has been subtracted from the evoked response (see Methods). In panel (H), a plus sign indicates a significant difference between B and NB responses (high gamma band, p < 0.05, rank-sum test, corrected). This difference likely indicates “contamination” from spontaneous activity. Since spontaneous LFP activity is present throughout the evoked response, elevations in this activity result in a smaller evoked decrease for B trials.
Figure 6
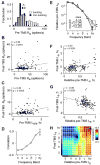
Figure 6. Influence of baseline variables on responses to TMS
(A) Distribution of stimulus-evoked responses (Re) during the baseline period for B (open, n = 60) and NB (filled, n = 56) trials. The average Re of B trials (mean ± std: 35 ± 19 spikes/s, open arrow) is slightly greater than that of the NB trials (28 ± 17 spikes/s, filled arrow), leading to a significant difference between the distributions (p<0.05, rank-sum test). B) Scatterplot of baseline evoked activity (Re) and post-TMS spontaneous activity (Rs) for all trials (n = 161). Pre-TMS evoked activity and post-TMS spontaneous activity are significantly correlated (r = 0.30, p<0.0001, t test). In this and subsequent panels, ‘post-TMS’ variables are defined as the average value over the first minute following TMS (i.e., interval I). In addition, displayed correlations cannot be explained by differences in pre-TMS spontaneous activity, TMS stimulation parameters, or trial number, as factors potentially contributing explanatory power have been linearly regressed from both variables using partial correlation (see Methods). C) Scatterplot of pre-TMS evoked LFP high gamma power relative to spontaneous power (Le/s, hγ; see Methods) and post-TMS spontaneous spiking (Rs) for trials with single-unit and LFP data (n = 138). D) Pearson correlation coefficients between baseline Le/s and post-TMS spontaneous spiking for all LFP frequency bands. Asterisk indicates a significant correlation (p<0.05, t test, corrected). Arrow denotes the coefficient for the data displayed in panel (C). E) Power of baseline spontaneous LFPs as a function of trial type. Here, the LFP power in each band is relative to the total spectral power (see Methods). Trials were classified as B or NB both by spiking activity (squares) and LFP power (circles). Single and double asterisks denote a significant difference between groups at p < 0.05 and p < 0.0005 criteria, respectively (rank-sum test, corrected). F,G) Scatterplots of the relative baseline spontaneous LFP power and the post-TMS spontaneous LFP power (n = 142 trials). A significant positive correlation is found between baseline high gamma power and post-TMS high gamma power (F). A significant negative correlation is found between baseline alpha power and post-TMS beta power (G). H) Correlation coefficients between the relative pre-TMS spontaneous power and the post-TMS spontaneous power for all frequency band combinations. To improve resolution beyond the six traditional bands (i.e., delta through high gamma), we divided the full frequency range (1 to 150 Hz) into 15 logarithmically-spaced bins. The (ij)th element in the matrix corresponds to the correlation coefficient between the relative Pre-TMS power in the ith frequency bin, and the post-TMS Ls in the jth frequency bin. Elements outlined in black correspond to the data displayed in panels (F) and (G).
Figure 7
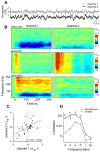
Figure 7. Correlations between TMS responses on different electrodes
A) Sample trace showing 8 s of spontaneous LFPs recorded from two different electrodes placed approximately 400 μm apart in area 17. Channel 1 denotes the electrode at which single-unit activity is isolated. B) Example spectrograms from 3 different TMS trials showing changes in spontaneous LFP power (ΔLs) on channel 1 (left) and channel 2 (right). The TMS parameters used in each trial are as follows: sb331×1424, 8 Hz, 4 s; sb283×0701, 4 Hz, 4 s; and sb331×1003, 8 Hz, 4 s. C) The changes in spontaneous theta band power (ΔLs, θ) on channels 1 and 2 are significantly correlated (n = 34, p< 0.0001, t test). Here, ΔLs, θ is calculated as the change in theta band power between the first minute post-TMS (interval I) and the pre-TMS baseline period. D) Pearson correlation coefficients for Δ Ls between channels 1 and 2 over all frequency bands. Asterisks indicate significant correlations (p< 0.05, t test, corrected). Arrow denotes the correlation coefficient for the data shown in panel (C). Note that possible confounds of these correlations (i.e., stimulation parameters and trial number) have been removed through partial correlation (see Methods).
Figure 8
Figure 8. Effect of TMS on spatial coherence
A) Average levels of inter-electrode LFP coherence (Cxy) during the pre-TMS baseline period for spontaneous (solid) and evoked (dotted) activity (n = 34 trials). Error bars signify ±1 s.e.m. Asterisks indicate significantly greater coherence during evoked activity (sign-rank test, p<0.05, corrected). B) Spectrograms displaying the change in inter-electrode coherence (ΔCxy) for spontaneous (top) and evoked (bottom) LFPs. ΔCxy is expressed as a percent change from baseline. C) Average ΔCxy for different time intervals and frequency bands. Significant changes in spontaneous (left) and evoked (right) coherence are denoted with asterisks (p<0.05, sign-rank test, corrected).

Similar articles

Cited by

References

    1. Allen EA, Pasley BN, Duong T, Freeman RD. Transcranial magnetic stimulation elicits coupled neural and hemodynamic consequences. Science. 2007;317:1918–1921. - PubMed
    1. Ambrosini A, de Noordhout AM, Sandor PS, Schoenen J. Electrophysiological studies in migraine: a comprehensive review of their interest and limitations. Cephalalgia. 2003;23 1:13–31. - PubMed
    1. Barker AT, Jalinous R, Freeston IL. Non-invasive magnetic stimulation of human motor cortex. Lancet. 1985;1:1106–1107. - PubMed
    1. Belitski A, Gretton A, Magri C, Murayama Y, Montemurro MA, Logothetis NK, Panzeri S. Low-frequency local field potentials and spikes in primary visual cortex convey independent visual information. J Neurosci. 2008;28:5696–5709. - PMC - PubMed
    1. Berardelli A, Inghilleri M, Rothwell JC, Romeo S, Curra A, Gilio F, Modugno N, Manfredi M. Facilitation of muscle evoked responses after repetitive cortical stimulation in man. Exp Brain Res. 1998;122:79–84. - PubMed

Publication types

LinkOut - more resources