. 2009 Jul-Aug;11(8-9):762-9.
doi: 10.1016/j.micinf.2009.04.016. Epub 2009 May 4.

The role of complement opsonization in interactions between F. tularensis subsp. novicida and human neutrophils

Affiliations

The role of complement opsonization in interactions between F. tularensis subsp. novicida and human neutrophils

Jason H Barker et al. Microbes Infect. 2009 Jul-Aug.

Abstract

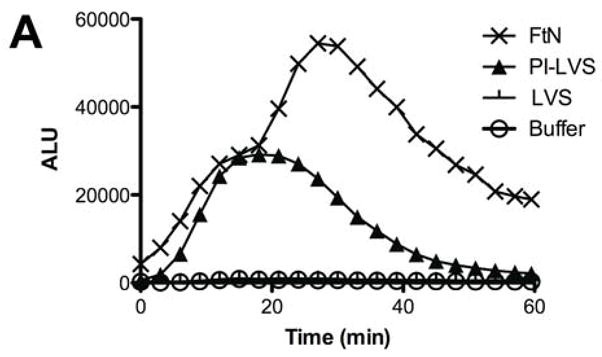
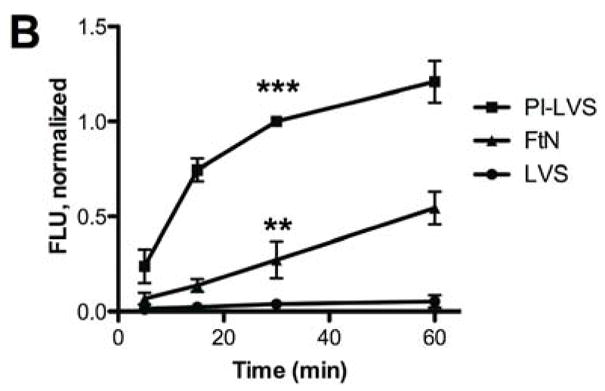
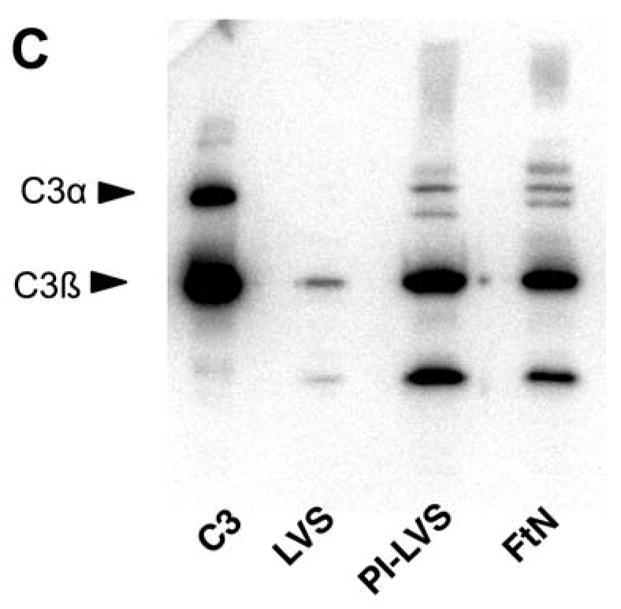
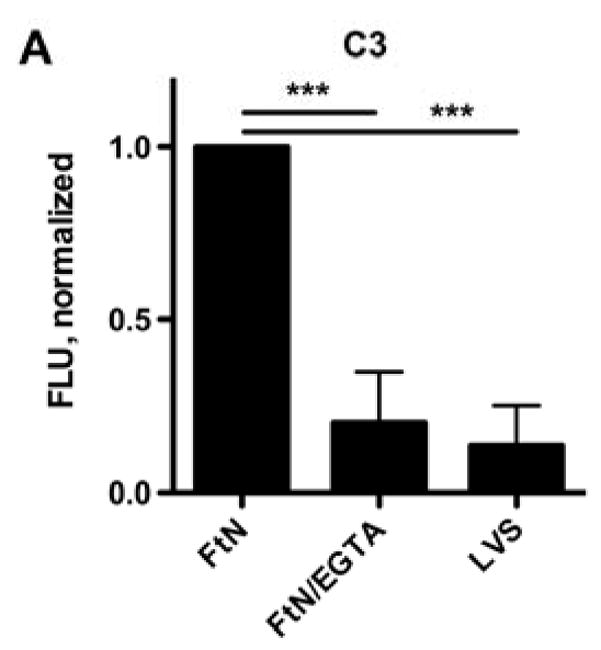
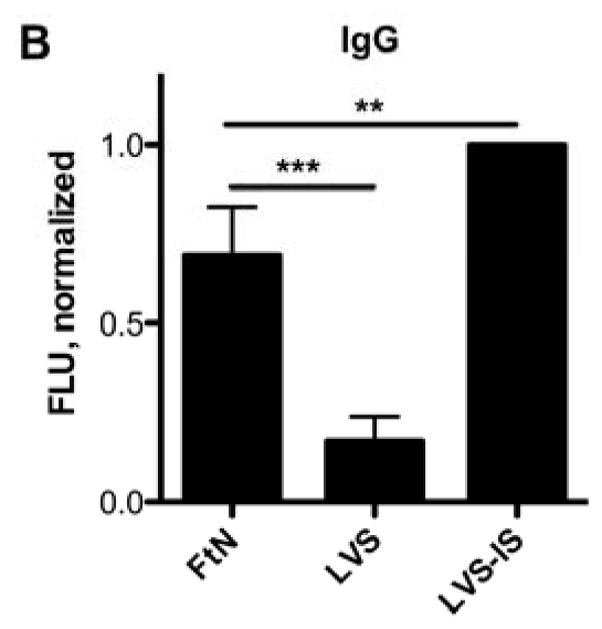
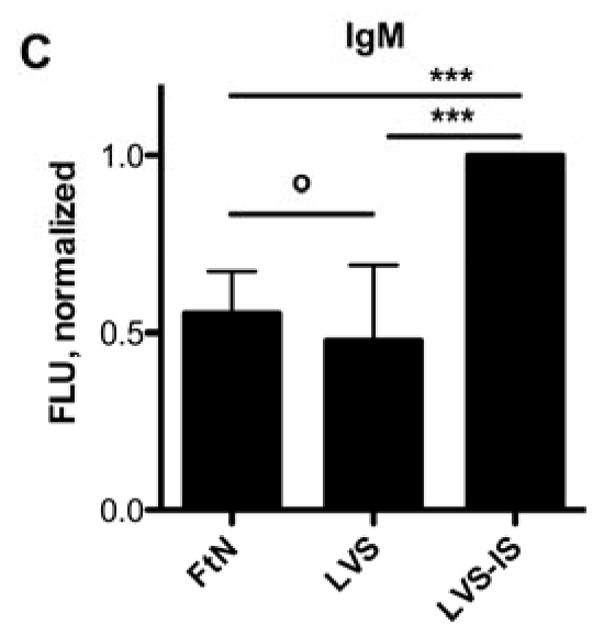
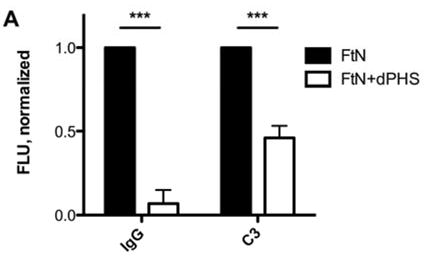
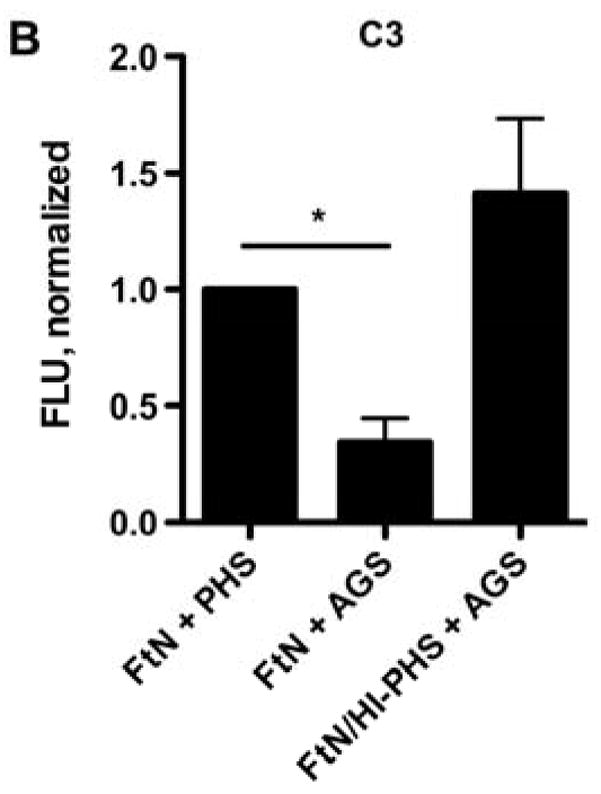
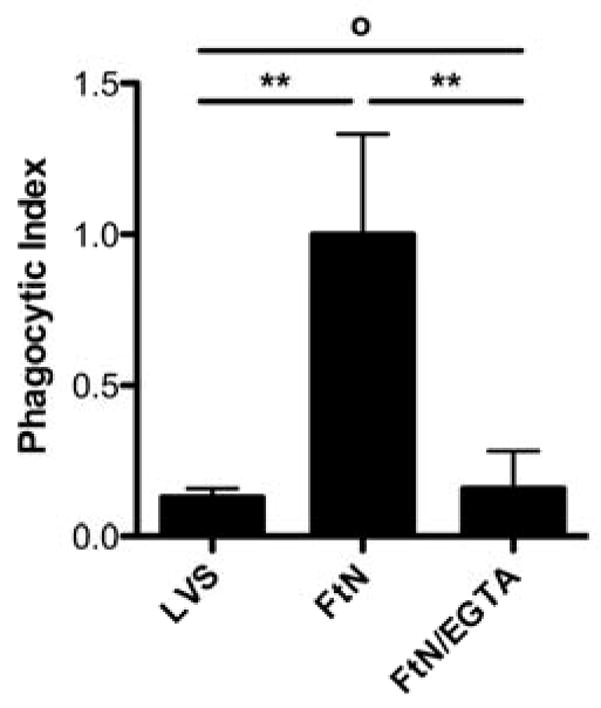
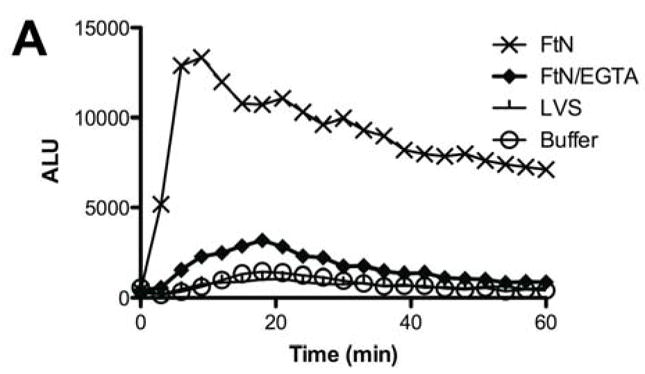
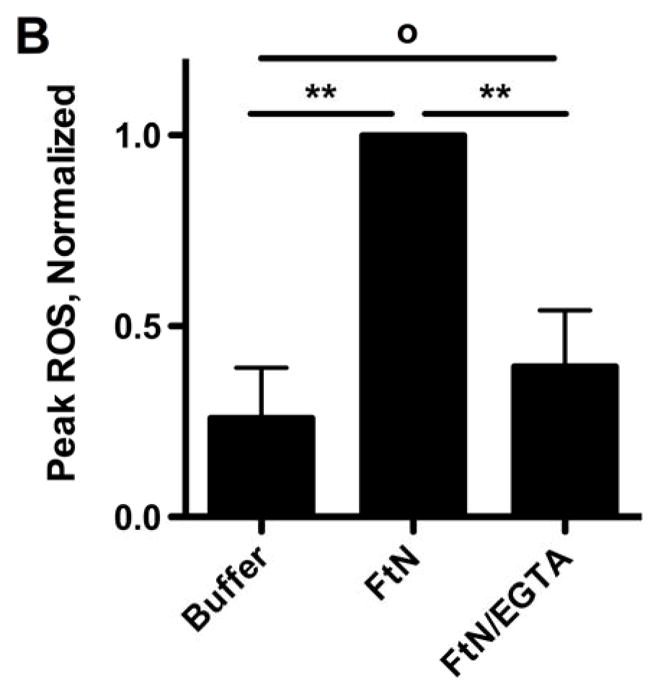
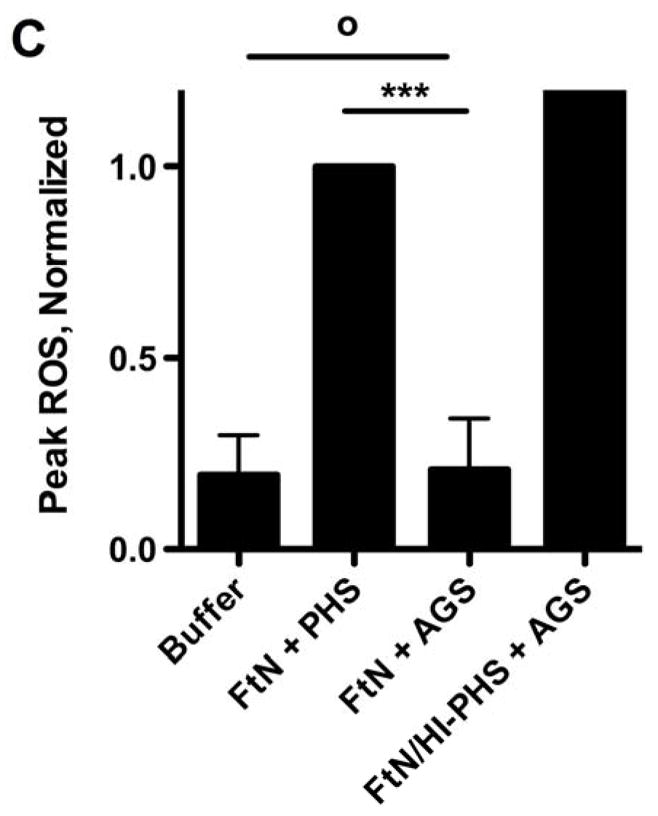
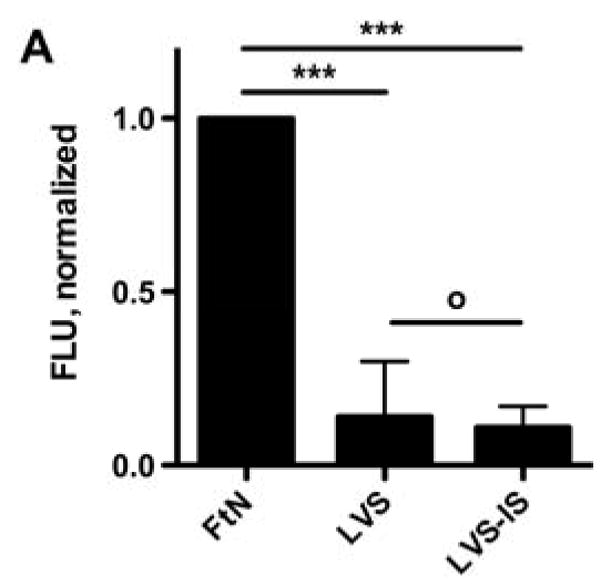
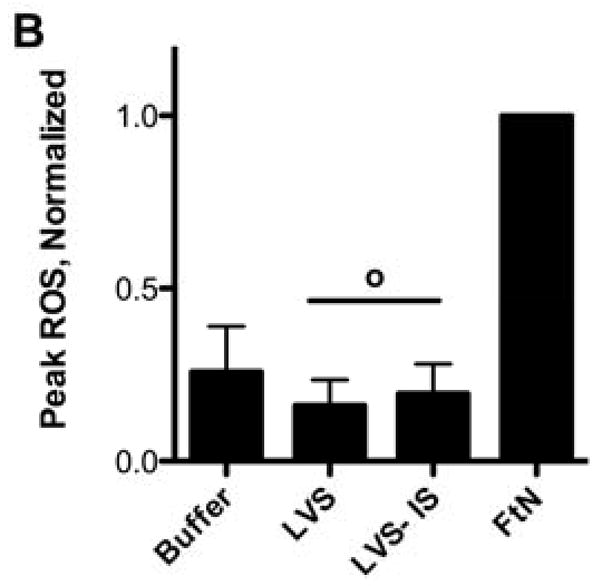
The remarkable infectiousness of Francisella tularensis suggests that the bacterium efficiently evades innate immune responses that typically protect the host during its continuous exposure to environmental and commensal microbes. In our studies of the innate immune response to F. tularensis, we have observed that, unlike the live vaccine strain (LVS) of F. tularensis subsp. holarctica, F. tularensis subsp. novicida U112 opsonized in pooled human serum activated the NADPH oxidase when incubated with human neutrophils. Given previous observations that F. tularensis fixes relatively small quantities of complement component C3 during incubation in human serum and the importance of C3 to neutrophil phagocytosis, we hypothesized that F. tularensis subsp. novicida may fix C3 in human serum more readily than would LVS. We now report that F. tularensis subsp. novicida fixed approximately six-fold more C3 than did LVS when incubated in 50% pooled human serum and that this complement opsonization was antibody-mediated. Furthermore, antibody-mediated C3 deposition enhanced bacterial uptake and was indispensable for the neutrophil oxidative response to F. tularensis subsp. novicida. Taken together, our results reveal important differences between these two strains of F. tularensis and may, in part, explain the low virulence of F. tularensis subsp. novicida for humans.


Figures

Fig. 1
Fig. 1
FtN stimulated LCL in human PMN and fixed complement component C3. (A) Bacteria were incubated in 50% PHS for 30 min, washed and incubated with human PMN. Control PMN were incubated in buffer without bacteria. Reactive oxidant species production was measured using LCL every 30 seconds. ALU, arbitrary light units. Results are representative of five experiments. (B) Bacteria were incubated in 50% PHS, and opsonization was stopped at the indicated times by adding ice-cold buffer with ethylenediaminetetraacetic acid (final concentration, 10 mM). Bacteria were then washed and incubated with anti-C3 fluorescent antibody. FLU, fluorescence light units. FLU were normalized based on the fluorescence of PI-LVS at 30 min. **, P < 0.01 compared to LVS at 30 min. ***, P < 0.001 compare to LVS at 30 min. N= 3. (C) Bacteria incubated in 50% PHS for 30 min were washed and subjected to immunoblotting for C3. Immunoreactive proteins corresponding to C3α and C3β are marked on the left. The α′-chain of C3 and its fragments can be seen on the blot as higher molecular weight bands that migrate more slowly than the C3 β-chain because they remain covalently bound to their bacterial targets. C3, purified complement component C3. The blot is representative of four independent experiments.
Fig. 1
Fig. 1
FtN stimulated LCL in human PMN and fixed complement component C3. (A) Bacteria were incubated in 50% PHS for 30 min, washed and incubated with human PMN. Control PMN were incubated in buffer without bacteria. Reactive oxidant species production was measured using LCL every 30 seconds. ALU, arbitrary light units. Results are representative of five experiments. (B) Bacteria were incubated in 50% PHS, and opsonization was stopped at the indicated times by adding ice-cold buffer with ethylenediaminetetraacetic acid (final concentration, 10 mM). Bacteria were then washed and incubated with anti-C3 fluorescent antibody. FLU, fluorescence light units. FLU were normalized based on the fluorescence of PI-LVS at 30 min. **, P < 0.01 compared to LVS at 30 min. ***, P < 0.001 compare to LVS at 30 min. N= 3. (C) Bacteria incubated in 50% PHS for 30 min were washed and subjected to immunoblotting for C3. Immunoreactive proteins corresponding to C3α and C3β are marked on the left. The α′-chain of C3 and its fragments can be seen on the blot as higher molecular weight bands that migrate more slowly than the C3 β-chain because they remain covalently bound to their bacterial targets. C3, purified complement component C3. The blot is representative of four independent experiments.
Fig. 2
Fig. 2
The majority of C3 fixation of FtN was calcium-dependent, and FtN bound more antibody in PHS than LVS. (A) Bacteria were incubated in 50% PHS for 30 min. The FTN/EGTA sample was supplemented with magnesium and EGTA to chelate calcium during serum incubation (see methods). C3was normalized to the value for FtN. N = 8. Identically-treated bacteria were assayed for IgG (B) and IgM (C) binding using immunofluorescent detection of bound antibody. Immunoglobulin FLU are normalized for the fluorescence value of LVS that had been incubated in a sub-agglutinating concentration of tularemia immune serum prior to incubation in 50% PHS (LVS-IS, see methods). N = 5. For all three panels, results are expressed as the mean ± the standard deviation (SD). °, P > 0.05; **, P < 0.01; ***, P < 0.001.
Fig. 2
Fig. 2
The majority of C3 fixation of FtN was calcium-dependent, and FtN bound more antibody in PHS than LVS. (A) Bacteria were incubated in 50% PHS for 30 min. The FTN/EGTA sample was supplemented with magnesium and EGTA to chelate calcium during serum incubation (see methods). C3was normalized to the value for FtN. N = 8. Identically-treated bacteria were assayed for IgG (B) and IgM (C) binding using immunofluorescent detection of bound antibody. Immunoglobulin FLU are normalized for the fluorescence value of LVS that had been incubated in a sub-agglutinating concentration of tularemia immune serum prior to incubation in 50% PHS (LVS-IS, see methods). N = 5. For all three panels, results are expressed as the mean ± the standard deviation (SD). °, P > 0.05; **, P < 0.01; ***, P < 0.001.
Fig. 3
Fig. 3
The majority of C3 fixation by FtN incubated in 50% PHS was antibody-dependent. (A) FtN were incubated for 30 min in 50% PHS that had been depleted of anti-FtN antibody (dPHS, see methods) and assayed as above for IgG (left) and C3 (right) binding. N = 3. Results are normalized to the values seen with FtN incubated in 50% PHS. (B) FtN was incubated in either 50% AGS or 40% PHS for 30 min and assessed for C3 binding (Because AGS had been dialyzed at the time of its collection to remove antibiotics, it had been diluted approximately 10%. Thus, 50% AGS was compared with 40% PHS). The rightmost sample was incubated in HI-PHS prior to incubation in AGS (FtN/HI-PHS + AGS). Results are normalized to the value seen with FtN incubated in 40% PHS. N = 3. Results are expressed as the mean ± SD. *, P < 0.05; ***, P < 0.001.
Fig. 3
Fig. 3
The majority of C3 fixation by FtN incubated in 50% PHS was antibody-dependent. (A) FtN were incubated for 30 min in 50% PHS that had been depleted of anti-FtN antibody (dPHS, see methods) and assayed as above for IgG (left) and C3 (right) binding. N = 3. Results are normalized to the values seen with FtN incubated in 50% PHS. (B) FtN was incubated in either 50% AGS or 40% PHS for 30 min and assessed for C3 binding (Because AGS had been dialyzed at the time of its collection to remove antibiotics, it had been diluted approximately 10%. Thus, 50% AGS was compared with 40% PHS). The rightmost sample was incubated in HI-PHS prior to incubation in AGS (FtN/HI-PHS + AGS). Results are normalized to the value seen with FtN incubated in 40% PHS. N = 3. Results are expressed as the mean ± SD. *, P < 0.05; ***, P < 0.001.
Fig. 4
Fig. 4
Optimal uptake of FtN by human PMN required calcium-dependent pathways of complement opsonization. PMN infected as described in Fig. 2A were assayed for intracellular bacteria after LCL had peaked (45–60 min). Phagocytic index was defined as the average number of ingested bacteria per PMN (with at least 100 PMN counted per sample). Uptake of LVS that had been incubated in 50% PHS for 30 min is included for comparison. N = 3. Results are expressed as the mean ± SD. °, P > 0.05; **, P < 0.01. When FtN are not opsonized in serum, bacterial uptake is negligible in identical infection conditions (phagocytic index < 0.02, data not shown).
Fig. 5
Fig. 5
The PMN LCL response to FtN required antibody-mediated C3 deposition. (A) Opsonized bacteria were incubated with human PMN at an MOI of 50:1 for 60 min. LCL was measured as in Fig. 1A. This result is representative of three independent experiments. (B) Peak ROS was determined for each sample in the three experiments represented by Fig. 5A and normalized to the peak FtN. Results are expressed as the mean ± SD. (C) FtN were opsonized in AGS or PHS as described in Fig. 3B prior to incubation with PMN, and peak LCL was determined. Uninfected PMN were incubated in identical buffer without bacteria. N = 3. Results are expressed as the mean ± SD. °, P > 0.05; **, P < 0.01; ***, P < 0.001.
Fig. 5
Fig. 5
The PMN LCL response to FtN required antibody-mediated C3 deposition. (A) Opsonized bacteria were incubated with human PMN at an MOI of 50:1 for 60 min. LCL was measured as in Fig. 1A. This result is representative of three independent experiments. (B) Peak ROS was determined for each sample in the three experiments represented by Fig. 5A and normalized to the peak FtN. Results are expressed as the mean ± SD. (C) FtN were opsonized in AGS or PHS as described in Fig. 3B prior to incubation with PMN, and peak LCL was determined. Uninfected PMN were incubated in identical buffer without bacteria. N = 3. Results are expressed as the mean ± SD. °, P > 0.05; **, P < 0.01; ***, P < 0.001.
Fig. 6
Fig. 6
LVS incubated in sub-agglutinating concentrations of tularemia immune serum failed to fix C3 (A) or stimulate PMN LCL (B). LVS-IS had been incubated in a sub-agglutinating concentration of tularemia immune serum, washed, and then incubated in 50% PHS as a source of active complement. C3 binding was determined as described in Fig. 2A. PMN were incubated with PMN and peak LCL determined as described in Fig. 4A. N = 3. °, P > 0.05; ***, P < 0.001.
Fig. 6
Fig. 6
LVS incubated in sub-agglutinating concentrations of tularemia immune serum failed to fix C3 (A) or stimulate PMN LCL (B). LVS-IS had been incubated in a sub-agglutinating concentration of tularemia immune serum, washed, and then incubated in 50% PHS as a source of active complement. C3 binding was determined as described in Fig. 2A. PMN were incubated with PMN and peak LCL determined as described in Fig. 4A. N = 3. °, P > 0.05; ***, P < 0.001.

References

    1. McLendon MK, Apicella MA, Allen LAH. Francisella tularensis: Taxonomy, genetics, and immunopathogenesis of a potential agent of biowarfare. Annu Rev Microbiol. 2006;60:167–185. - PMC - PubMed
    1. Dennis DT, Inglesby TV, Henderson DA, Bartlett JG, Ascher MS, Eitzen E, Fine AD, Friedlander AM, Hauer J, Layton M, Lillibridge SR, McDade JE, Osterholm MT, O’Toole T, Parker G, Perl TM, Russell PK, Tonat K. Tularemia as a biological weapon: medical and public health management. JAMA. 2001;285:2763–2773. - PubMed
    1. Lyons CR, Wu TH. Animal models of Francisella tularensis infection. Ann N Y Acad Sci. 2007;1105:238–265. - PubMed
    1. Owen CR, Buker EO, Jellison WL, Lackman DB, Bell JF. Comparative studies of Francisella tularensis and Francisella novicida. J Bacteriol. 1964;87:676–683. - PMC - PubMed
    1. Elkins KL, Cowley SC, Bosio CM. Innate and adaptive immunity to Francisella. Ann N Y Acad Sci. 2007;1105:284–324. - PubMed

Publication types

MeSH terms

LinkOut - more resources