. 2009 May;30(5):696-707.
doi: 10.1016/j.immuni.2009.02.011. Epub 2009 Apr 30.

NKAP is a transcriptional repressor of notch signaling and is required for T cell development

Affiliations

NKAP is a transcriptional repressor of notch signaling and is required for T cell development

Anthony G Pajerowski et al. Immunity. 2009 May.

Abstract

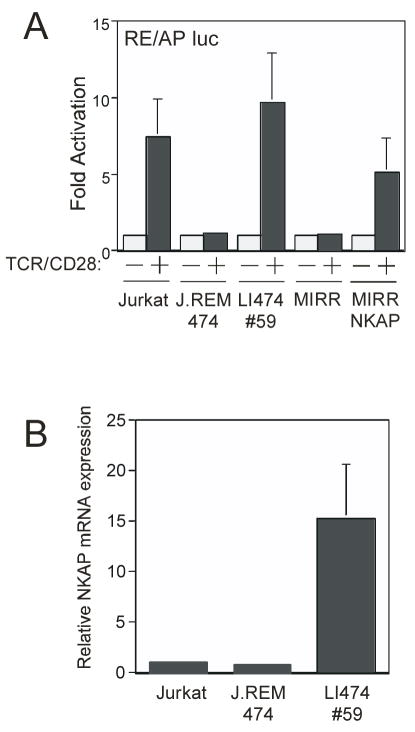
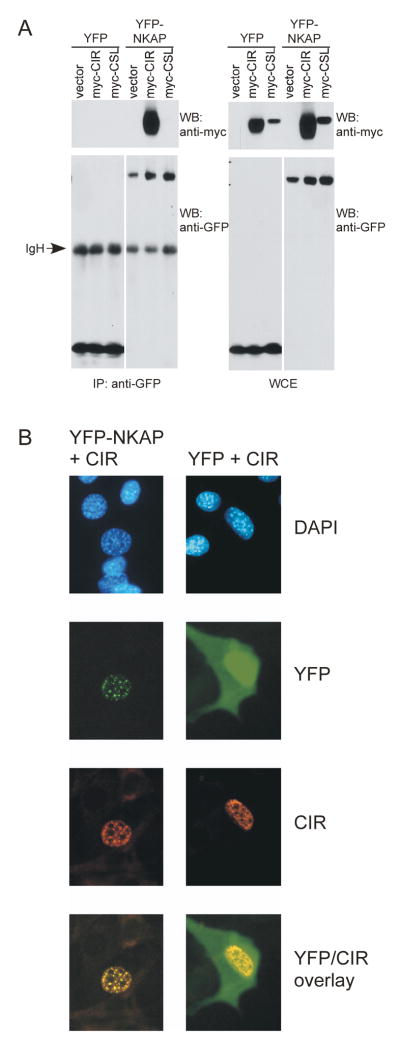
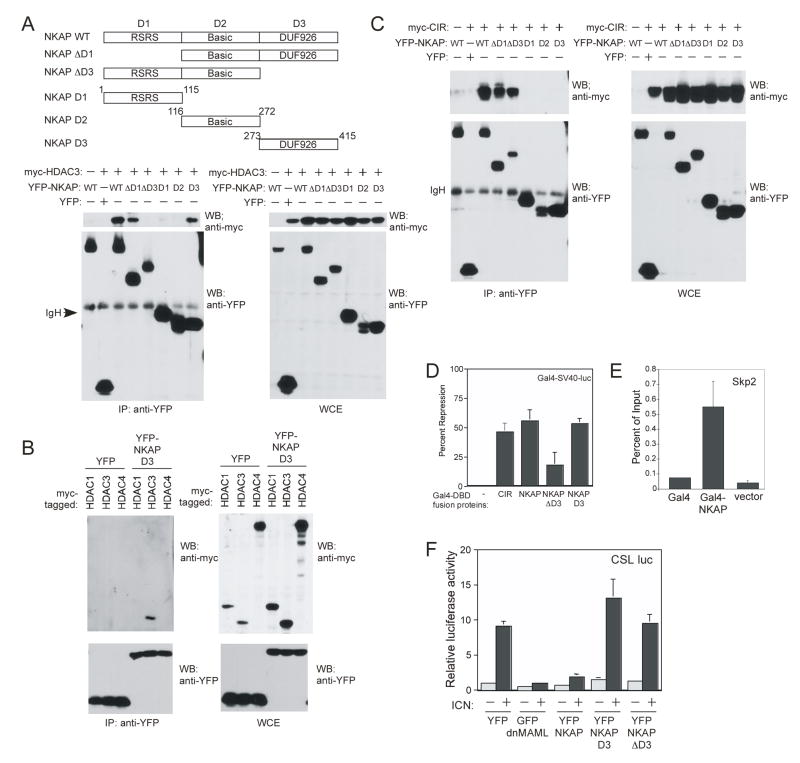
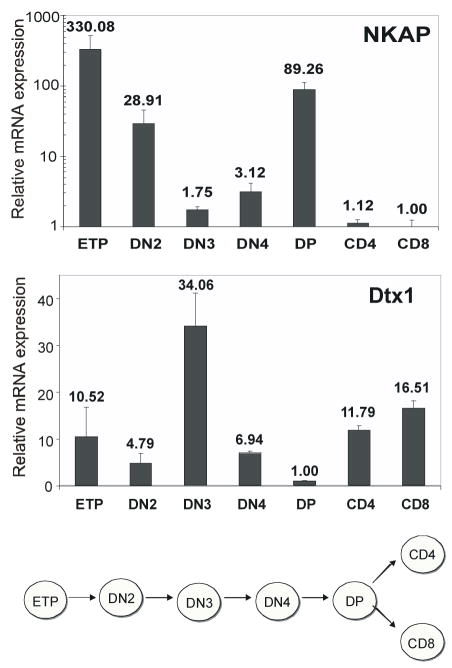
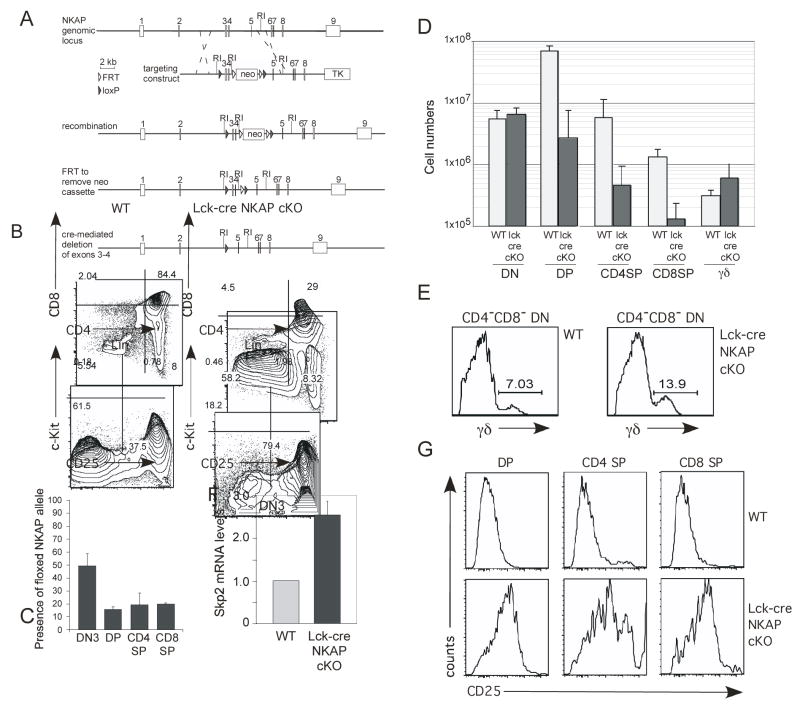
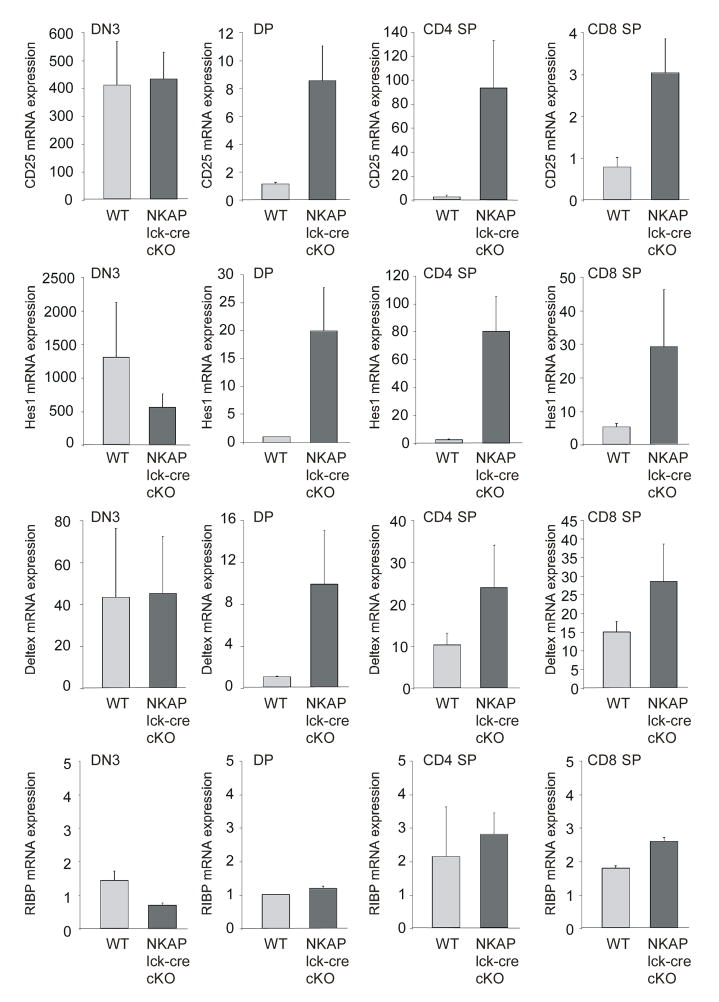
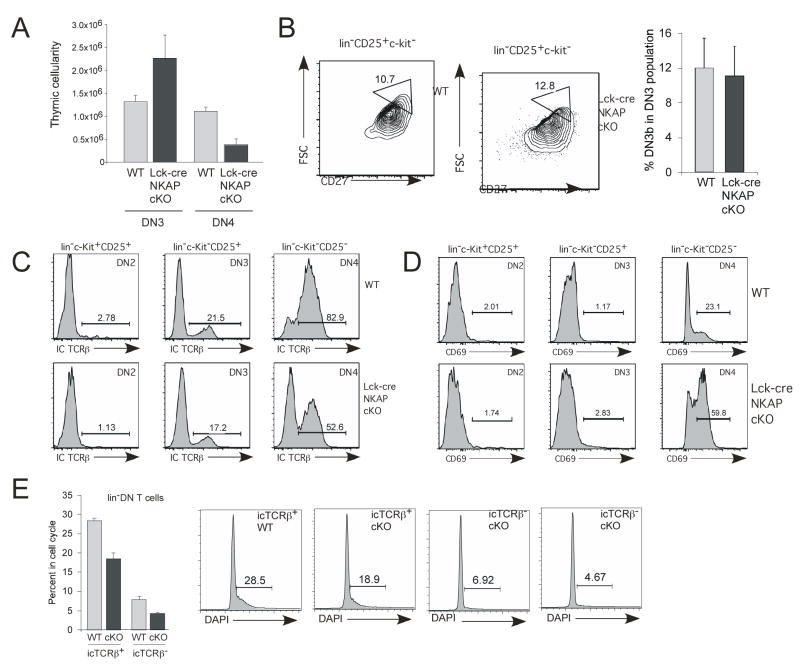
T cell development depends on the coordinated interplay between receptor signaling and transcriptional regulation. Through a genetic complementation screen a transcriptional repressor, NKAP, was identified. NKAP associated with the histone deacetylase HDAC3 and was shown to be part of a DNA-binding complex, as demonstrated by chromatin immunoprecipitation. NKAP also associated with the Notch corepressor complex. The expression of NKAP during T cell development inversely correlated with the expression of Notch target genes, implying that NKAP may modulate Notch-mediated transcription. To examine the function of NKAP in T cell development, we ablated NKAP by Lck(cre). Loss of NKAP blocked development of alphabeta but not gammadelta T cells, and Nkap(fl/o)Lck(cre) DP T cells expressed 8- to 20-fold higher amounts of Hes1, Deltex1, and CD25 mRNA. Thus, NKAP functions as a transcriptional repressor, acting on Notch target genes, and is required for alphabeta T cell development.


Conflict of interest statement

The authors state that they have no financial conflict of interest.

Figures

Figure 1
Figure 1. Genetic complementation of a T cell activation defect by NKAP
(A) Wild-type Jurkat T cells, J.REM 474, LI474-59, MIRR or MIRR NKAP transduced J.REM474 cells were transfected with an RE/AP luciferase reporter. The following day, cells were left unstimulated or stimulated with anti-TCR and anti-CD28. Results are shown as fold activation of stimulated relative to unstimulated controls (=1). Error bars reflect SEM from three independent transfections. (B) RNA was generated from wild-type Jurkat, J.REM 474 and LI474-59 cell lines and analyzed by Q-PCR using NKAP mRNA expression.
Figure 2
Figure 2. Association and colocalization of NKAP with CIR
(A) 293T cells were transfected with YFP or YFP-NKAP expression plasmids, with either empty vector, myc-CIR or myc-CSL. The next day, cell extracts were generated and subject to immunoprecipitation with anti-GFP. Samples of extracts (WCE) and immunoprecipitates (IP) were analyzed by Western blotting (WB) with either anti-myc to examine CIR and CSL coprecipitation or anti-GFP to assess immunoprecipitation. Secondary antibody cross-reactivity to the immunoglobulin heavy chain (IgH) used in IP is denoted in the figure. (B) NIH 3T3 cells were transfected with either YFP or YFP-NKAP, in addition to myc-CIR expression plasmids. The next day, cells were fixed, permeabilized and stained with rabbit anti-myc. DAPI was used to delineate nuclei. In the bottom panel, myc and YFP are overlaid.
Figure 3
Figure 3. NKAP independently associates with CIR and HDAC3
(A) Co-immunoprecipitation experiments were performed as in figure 2A, using myc-HDAC3 with full length YFP-NKAP or truncations as denoted in schematic to map the site of NKAP with HDAC3. (B) Co-immunoprecipitation experiments were performed as in figure 2A, using YFP-tagged NKAP D3 cotransfected into 293T cells with myc-tagged HDAC1, HDAC3 and HDAC4. (C) Co-immunoprecipitation experiments were performed as in figure 2A, to map the site of NKAP association with myc-tagged CIR. (D) Gal4DBD-fusion proteins were generated with full-length CIR, full-length NKAP or NKAP ΔD3 and D3 truncations (as outlined in figure 3A). NIH3T3 cells were transfected with 0.1 μg of a Gal3-SV40-luciferase reporter, alone with 0.1 μg of either Gal4DBD alone or Gal4DBD-CIR, Gal4DBD-NKAP, Gal4DBD-NKAP ΔD3 or Gal4DBD-NKAP D3 expression plasmids. Results shown are the average of three independent experiments, shown as percent repression compared to the relative luciferase activity of the reporter transfected with Gal4DBD alone. Error bars show SEM. (E) Gal4-TK-293T cells were transfected with Gal4DBD, Gal4DBD-NKAP or empty vector, and ChIP were performed using anti-Gal4. Input DNA from each transfection and IP was analyzed for Skp2 promoter genomic sequence. Data shown is from three independent IPs for each sample, and is shown as percent of input recovered in the ChIPs. Error bars show SEM. (F) NIH3T3 cells were transfected with CSL-luciferase reporter, in the presence or absence of ICN, with either YFP, GFP-dnMAML, YFP-NKAP, YFP NKAP D3 or YPF-NKAPΔD3 expression plasmids. The next day, luciferase activity was quantified. Data from triplicate experiments were internally standardized to the amount of luciferase activity from YFP-transfected alone (=1). Error bars reflect SEM.
Figure 4
Figure 4. NKAP expression during T cell development inversely correlates with the expression of the Notch target gene Deltex1
Thymocytes at different stages of development were isolated by FACS sorting. mRNA was generated and examined by quantitative PCR for NKAP and Dtx1 mRNA expression. The level of mRNA is normalized relative to the sorted population with the lowest expression of either NKAP or Dtx1 (=1). The average mRNA level from triplicate Q-PCRs is indicated above the bar. Relative NKAP mRNA levels are shown on a logarithmic scale, while Dtx1 is shown on a linear scale.
Figure 5
Figure 5. NKAP is required for T cell development
(A) Schematic of the targeting construct used to generated floxed NKAP mice (B, E) Thymocytes from lck-cre NKAP cKO and a wild-type control mouse was examined for T cell populations by flow cytometry as denoted in the figure. (C) Genomic DNA from sorted wt and lck-cre NKAP cKO thymocyte populations were examined by Q-PCR for the presence of the floxed NKAP allele, using PCR primers which flank the upstream loxP site. Within each population, signal from lck-cre NKAP cKO populations were normalized to floxed, cre-negative wildtype populations. Error bars reflect SEM from triplicate samples. (D) Absolute numbers of total DN, DP, CD4 SP, and CD8 SP cells from wild-type and lck-cre NKAP cKO mice were calculated. Results shown are the average absolute numbers, from between 3–5 lck-cre NKAP cKO and 3–5 wild-type mice, at 8–10 weeks of age. Error bars reflect SEM. (F) DN3 thymocytes from wild-type and lck-cre NKAP cKO mice were isolated by FACS sorting. mRNA was generated and examined by Q-PCR for Skp2 mRNA expression, and normalized relative to wt Skp2 expression (=1). The data shown is from two wild-type and two cKO mice, each from independent sorts and independent Q-PCR. Error bars reflect SEM. (G) Thymocyte populations from wild-type and cKO mice were analyzed for expression of CD25 as denoted in the figure.
Figure 6
Figure 6. Potentiation of Notch target gene expression in the absence of NKAP
DN3, DP, CD4 SP and CD8 SP thymocytes from wild-type and lck-cre NKAP cKO mice were isolated by FACS sorting. mRNA was generated and examined by quantitative PCR for CD25, Hes1, Deltex1 and RIBP mRNA expression levels, and normalized relative to the sorted wild-type population with the lowest expression of each gene (=1). The data shown is from two wild-type and three lck-cre NKAP cKO mice, each from independent sorts and independent Q-PCR. Error bars reflect SEM.
Figure 7
Figure 7. pre-TCR signaling is intact in Lck-cre NKAP cKO mice
(A) Absolute numbers of total DN3 (linCD25+c-kit, or CD4CD8CD25+CD44) and DN4 (linCD25+c-kit) cells from five wild-type and three cKO mice were calculated, as in figure 5D above. Error bars reflect SEM. (B) Flow cytometry was performed to analyze the percent of cells in DN3a (linCD25+c-kitCD27medFSCmed) and DN3b populations (triangular gate, linCD25+c-kitCD27hiFSChi). Shown is a representative FACS plot to show gating strategy, with average DN3b percentage calculated from three wt and four cKO mice also shown. Error bars reflect SEM. (C, D) FACS was performed to analyze expression of intracellular TCRβ (IC TCRβ) and CD69 expression on the cell surface of DN2, DN3 and DN4 cells. Shown is representative data from two independent experiments. (E) FACS was performed to analyze cell cycle status of IC TCRβ+ and IC TCRβ linDN thymocytes. Shown is a representative FACS plot to indicate gating strategy, with average % cell cycle (S+G2M) calculated from analysis of three wt and three cKO mice. Error bars reflect SEM.

References

    1. Abraham RT, Weiss A. Jurkat T cells and development of the T-cell receptor signalling paradigm. Nat Rev Immunol. 2004;4:301–308. - PubMed
    1. Chen D, Li Z, Yang Q, Zhang J, Zhai Z, Shu HB. Identification of a nuclear protein that promotes NF-κB activation. Biochem Biophys Res Commun. 2003;310:720–724. - PubMed
    1. Cowley SM, Iritani BM, Mendrysa SM, Xu T, Cheng PF, Yada J, Liggitt HD, Eisenman RN. The mSin3A chromatin-modifying complex is essential for embryogenesis and T cell development. Mol Cell Biol. 2005;25:6990–7004. - PMC - PubMed
    1. Dohda T, Maljukova A, Liu L, Heyman M, Grander D, Brodin D, Sangfelt O, Lendahl U. Notch signaling induces Skp2 expression and promotes reduction of p27Kip1 in T-cell acute lymphoblastic leukemia cell lines. Exp Cell Res. 2007;313:3141–3142. - PubMed
    1. Ellisen LW, Bird J, West DC, Soreng AL, Reynolds TC, Smith SD, Sklar J. TAN-1, the human homolog of the Drosophila notch gene, is broken by chromosomal translocations in T lymphoblastic neoplasms. Cell. 1991;66:649–661. - PubMed

Publication types

MeSH terms