

Non-Darwinian estimation: my ancestors, my genes' ancestors
- PMID: 19411595
- PMCID: PMC3647532
- DOI: 10.1101/gr.076539.108
Non-Darwinian estimation: my ancestors, my genes' ancestors
Abstract
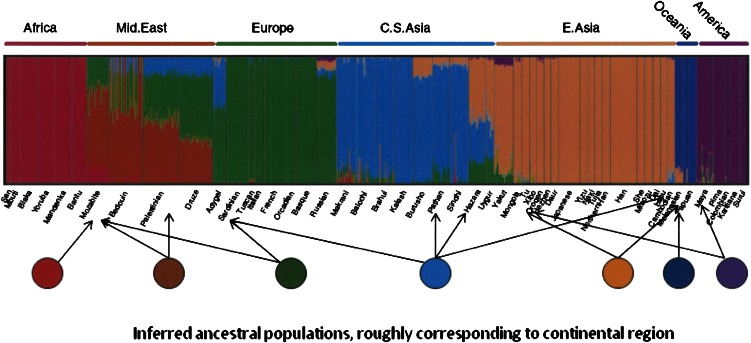
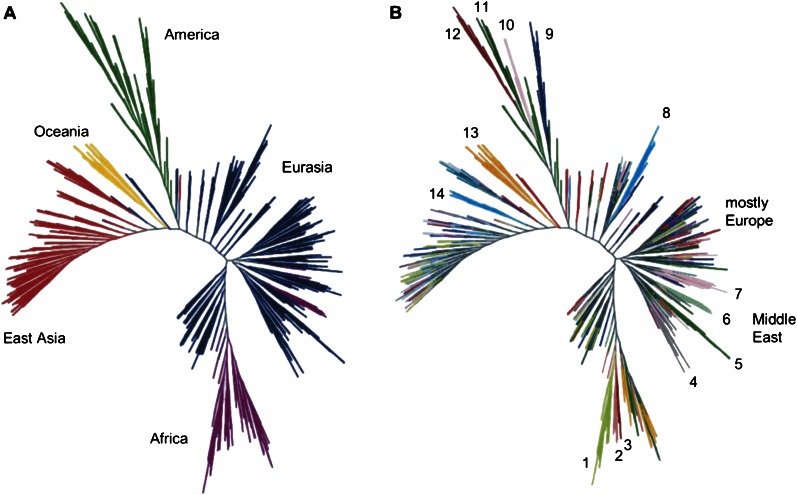
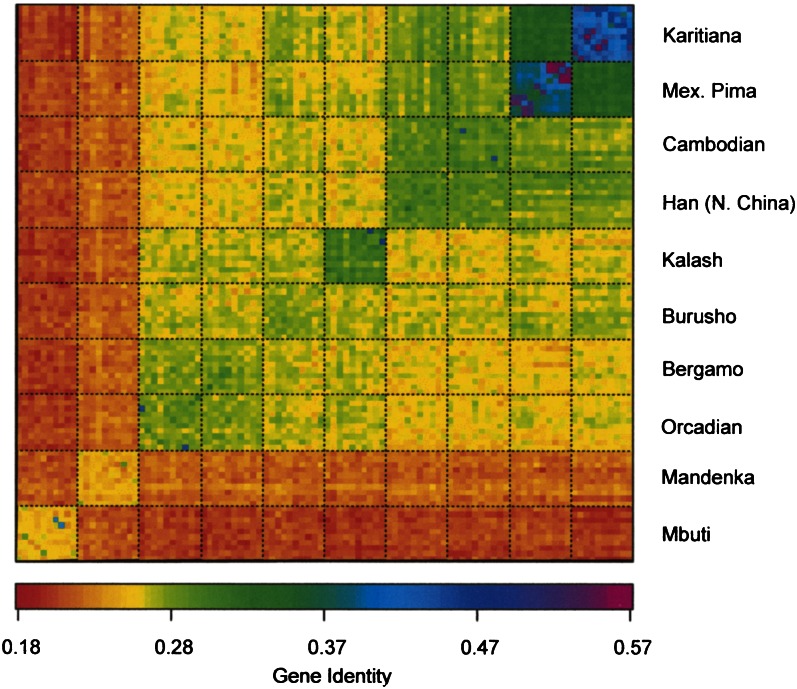
There is widespread interest in characterizing the organization of human genetic variation around the world from a population perspective. Related to this are attempts to describe the pattern of genetic variation in the human species generally, including "recreational" genomics, the genome-based estimation of the ancestry of individuals. These approaches rest on subtle concepts of variation, time, and ancestry that are perhaps not widely appreciated. They share the idea that there are, or were, discrete panmictic human populations such that every person is either a member of such a population or is an admixed descendant of them. Ancestry fraction estimation is biased by assumptions about past and present human population structure, as when we trace ancestry to hypothetical unmixed ancestral populations, or assign an individual's ancestry to continental populations that are indistinguishable from classical "races." Attempts to identify even individuals' local subpopulations are less precise than most (geneticists included) expect, because that is usually based on a small portion of a person's ancestry, relative to the much larger pool of comparably related ancestors. It is easier to show that two people have some relationship than to show who or where the actual ancestor was. There is an important distinction between individuals' demographic ancestry and the ancestry of their genes. Despite superficial appearances, these interpretations of genetic data are often based on typological rather than Darwinian thinking, raising important issues about the questions that are actually being asked.
Figures
References
-
- Bamshad M., Wooding S., Salisbury B.A., Stephens J.C. Deconstructing the relationship between genetics and race. Nat. Rev. Genet. 2004;5:598–609. - PubMed
-
- Baur E., Fischer E., Lenz F. Human heredity. Macmillan; New York: 1931.
-
- Bolnick D.A., Fullwiley D., Duster T., Cooper R.S., Fujimura J.H., Kahn J., Kaufman J.S., Marks J., Morning A., Nelson A., et al. Genetics. The science and business of genetic ancestry testing. Science. 2007;318:399–400. - PubMed
-
- Boyd W.C. Genetics and the races of man: An introduction to modern physical anthropology. Little Brown; Boston: 1950.
Publication types
MeSH terms
Grants and funding
LinkOut - more resources
Full Text Sources
Miscellaneous