. 2009 May;19(5):711-22.
doi: 10.1101/gr.086652.108.

Constructing genomic maps of positive selection in humans: where do we go from here?

Affiliations

Constructing genomic maps of positive selection in humans: where do we go from here?

Joshua M Akey. Genome Res. 2009 May.

Abstract

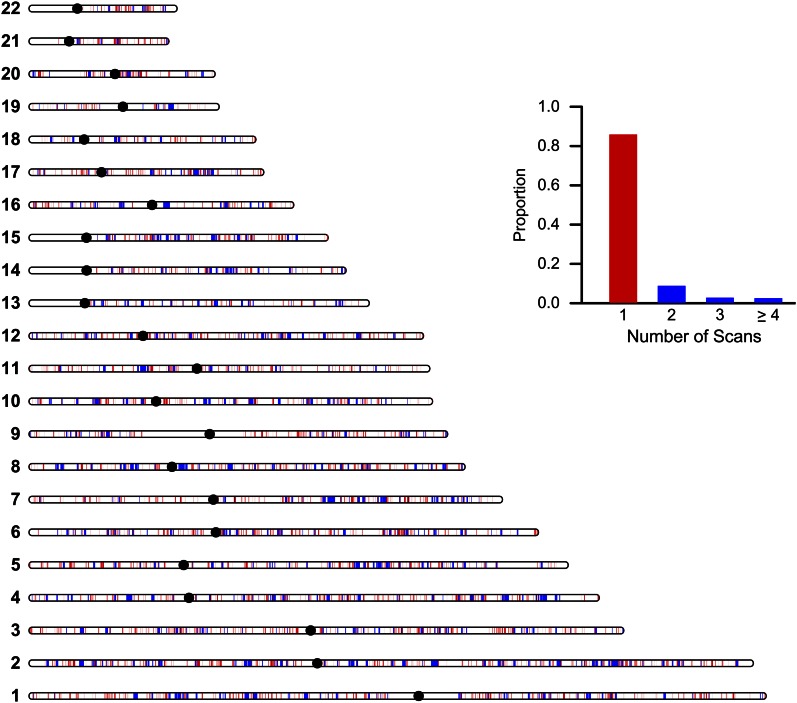
Identifying targets of positive selection in humans has, until recently, been frustratingly slow, relying on the analysis of individual candidate genes. Genomics, however, has provided the necessary resources to systematically interrogate the entire genome for signatures of natural selection. To date, 21 genome-wide scans for recent or ongoing positive selection have been performed in humans. A key challenge is to begin synthesizing these newly constructed maps of positive selection into a coherent narrative of human evolutionary history and derive a deeper mechanistic understanding of how natural populations evolve. Here, I chronicle the recent history of the burgeoning field of human population genomics, critically assess genome-wide scans for positive selection in humans, identify important gaps in knowledge, and discuss both short- and long-term strategies for traversing the path from the low-resolution, incomplete, and error-prone maps of selection today to the ultimate goal of a detailed molecular, mechanistic, phenotypic, and population genetics characterization of adaptive alleles.


Figures

Figure 1.
Figure 1.
A typical population genomics study design for detecting positive selection. Population genomic studies begin by sampling loci, typically SNPs, throughout the genome. The majority of loci are presumably influenced only by genome-wide forces such as genetic drift (indicated by dark gray boxes). Additional loci, however, may have been subject to locus-specific forces such as selection (indicated by red boxes). Gene genealogies from a sample of three individuals are shown above each locus to emphasize that significant variation in genealogies, and thus, patterns of genetic variation are expected throughout the genome. The extent of variation in genealogies depends on many underlying parameters such as population demographic history and local rates of recombination. For each sampled locus, a statistic of interest (denoted here as Ti for the ith locus) is calculated, an empirical distribution is constructed, and outlier loci are identified in the tail of the empirical distribution. Implicit assumptions of a population genomics approach are that loci are independent, drift influences all loci equally, and selection is strong enough to pull individual loci out into the tail of the empirical distribution. It is important to note that simply occurring in the tail of an empirical distribution does not prove that a locus has been influenced by selection; rather, all one can conclude is that the locus simply has patterns of genetic variation that are unusual in some respect relative to the rest of the genome. Indeed, as shown in the empirical distribution, it is inevitable that some selected loci will not appear as outliers (false negatives) and some neutral loci will appear as outliers (false positives). The lighter red and gray shadings of the empirical distribution reflect that each part of the distribution is a mixture of selected and neutral loci.
Figure 2.
Figure 2.
Integrated genomic map of positive selection. Vertical red lines on each autosome indicate loci that were identified in a single genome-wide scan, and blue lines denote regions identified in two or more studies. The histogram shows the proportion of putatively selected loci (y-axis) as a function of the number of genome-wide scans in which they were identified (x-axis).
Figure 3.
Figure 3.
Bottom-up population genomics. Genome-wide scans of positive selection are agnostic to phenotypic data and make inferences of selection directly from patterns of genetic variation (dashed black arrow). However, selection acts directly on phenotypic variation and only indirectly on DNA sequence variation (dark green arrows). Solid black arrows show that the path from genetic to phenotypic variation runs through dynamic molecular networks (such as regulatory, protein, and metabolite). Scale-free molecular networks were simulated with the R package igraph and visualized in CytoScape (Cline et al. 2007).

Similar articles

Cited by

References

    1. Ahmed Z.M., Riazuddin S., Ahmad J., Bernstein S.L., Guo Y., Sabar M.F., Sieving P., Griffith A.J., Friedman T.B., Belyantseva I.A., et al. PCDH15 is expressed in the neurosensory epithelium of the eye and ear and mutant alleles are responsible for both USH1F and DFNB23. Hum. Mol. Genet. 2003;12:3215–3223. - PubMed
    1. Akey J.M., Zhang G., Zhang K., Jin L., Shriver M.D. Interrogating a high-density SNP map for signatures of natural selection. Genome Res. 2002;12:1805–1814. - PMC - PubMed
    1. Akey J.M., Zhang K., Xiong M., Jin L. The effect of single nucleotide polymorphism identification strategies on estimates of linkage disequilibrium. Mol. Biol. Evol. 2003;20:232–242. - PubMed
    1. Akey J.M., Eberle M.A., Rieder M.J., Carlson C.S., Shriver M.D., Nickerson D.A., Kruglyak L. Population history and natural selection shape patterns of genetic variation in 132 genes. PLoS Biol. 2004;2:e286. doi: 10.1371/journal.pbio.0020286. - DOI - PMC - PubMed
    1. Akey J.M., Swanson W.J., Madeoy J., Eberle M., Shriver M.D. TRPV6 exhibits unusual patterns of polymorphism and divergence in worldwide populations. Hum. Mol. Genet. 2006;15:2106–2113. - PubMed

Publication types

LinkOut - more resources