. 2009 Jun;6(6):451-7.
doi: 10.1038/nmeth.1328. Epub 2009 May 3.

High-throughput ethomics in large groups of Drosophila

Affiliations

High-throughput ethomics in large groups of Drosophila

Kristin Branson et al. Nat Methods. 2009 Jun.

Abstract

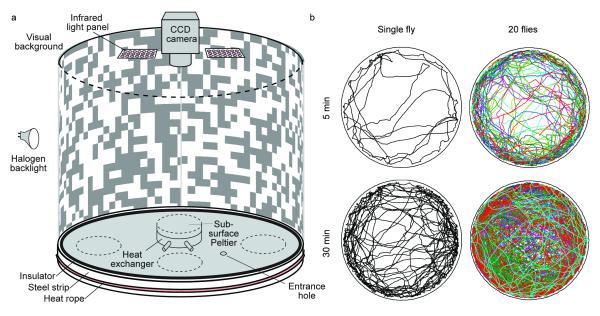
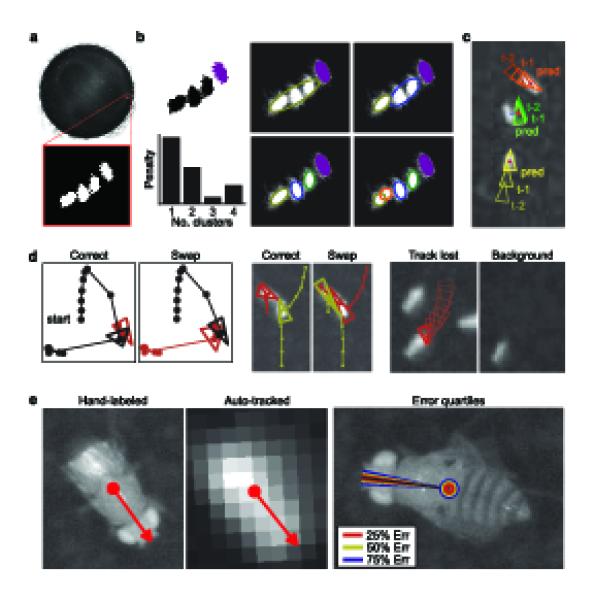
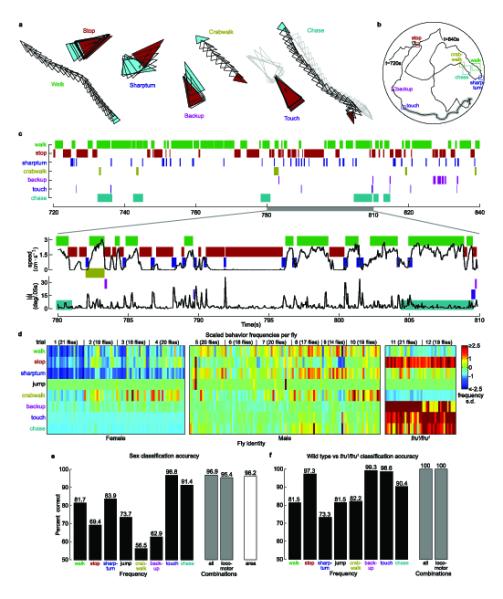
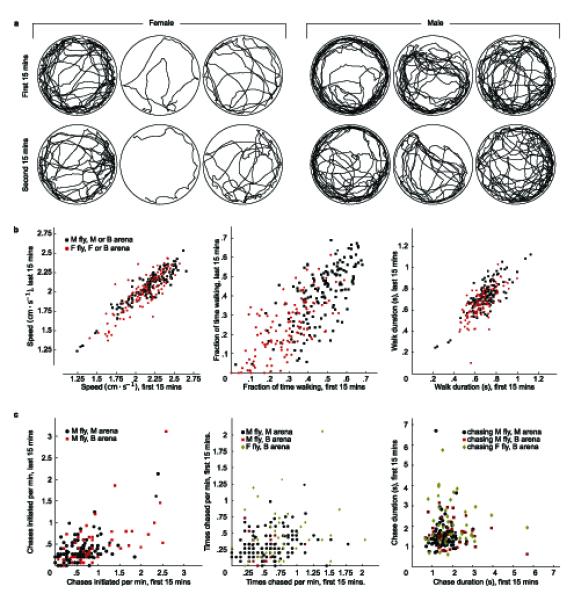
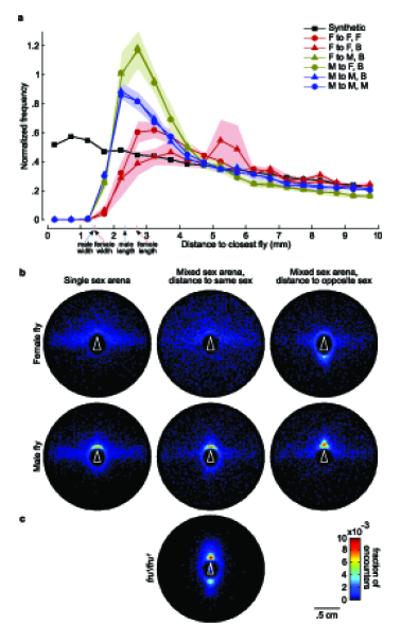
We present a camera-based method for automatically quantifying the individual and social behaviors of fruit flies, Drosophila melanogaster, interacting in a planar arena. Our system includes machine-vision algorithms that accurately track many individuals without swapping identities and classification algorithms that detect behaviors. The data may be represented as an ethogram that plots the time course of behaviors exhibited by each fly or as a vector that concisely captures the statistical properties of all behaviors displayed in a given period. We found that behavioral differences between individuals were consistent over time and were sufficient to accurately predict gender and genotype. In addition, we found that the relative positions of flies during social interactions vary according to gender, genotype and social environment. We expect that our software, which permits high-throughput screening, will complement existing molecular methods available in Drosophila, facilitating new investigations into the genetic and cellular basis of behavior.


Figures

Figure 1
Figure 1
Walking arena with sample trajectories. (a) Schematic diagram of the walking arena. A 24.5 cm tall printed paper cylinder is backlit by an array of 8 halogen lights (only one shown). At the top is a 1280×1024-pixel camera with 8 mm lens and infrared pass filter, and 2 arrays of 850 nm LEDs. The circular, 24.5 cm-diameter, 6 mm-thick aluminum base is thermally controlled by four Peltier devices and heat-exchangers mounted on the underside (only one shown) and is surrounded by a heat barrier composed of an insulating strip and a galvanized steel ring heated by thermal tape. Flies are loaded into the chamber through a hole in the floor with replaceable stopper. (b) The x,y position of a single fly or of 20 flies for 5 and 30 minutes of a trial. Supplementary Videos 1-3 each show 2 minutes of trajectories for 50 flies.
Figure 2
Figure 2
Tracking algorithm and evaluation. (a) Example frame with the foreground/background classification for pixels within a subwindow. (b) Detection of individual flies We show the connected components of foreground pixels. The purple component corresponds to one fly; the large black component corresponds to three. The tracker splits this large component into 1–4 clusters. The penalty based on cluster size is shown for each choice. [CE: units of penalty are arbitrary. AU says: The units of ‘penalty’ relate to the heuristic described in Methods and Supplementary Note are somewhat arbitrary. Technically, the units are ‘pixels squared’.] (c) Identity matching. Red dots indicate the detected fly positions in frame t; triangles indicate the tracked positions at frames t - 2 and t – 1 and the predicted position (pred) at frame t. Blue lines indicate the lowest-cost match between predicted and detected positions. (d) Example identity errors. (left) One fly (black) jumps near a stationary fly (red), and identities are swapped. We plot the correct and automatically computed trajectories. Triangles indicate the positions of the flies at the frame of the swap; circles indicate their trajectories. (middle) A large connected component is split incorrectly. (right) The lower left fly sits still during the majority of the trial, becoming part of the background model. We show the frame in which the fly’s trajectory is lost as well as the background model at that instant. (e) Accuracy of position and orientation. (left) We compare the center and orientation of a fly manually labeled on a high-resolution image (60 px·mm-1) to those automatically computed from a low-resolution image (4 px·mm-1). (right) Quartiles of the sampled center position and orientation errors plotted on an example high-resolution image. The median error was 0.0292 mm (0.117 px) for the center and 3.14° for the orientation.
Figure 3
Figure 3
Ethograms of eight automatically-detected behaviors. (a) Examples of behaviors detected (from trajectory in (b)). Triangles indicate the fly’s positions in every frame. A cyan/red triangle is plotted at the start/end of the behavior. For touching and chasing, we plot in gray the position of the other fly. In all panels, each behavior is coded by a different color. (b) Sample 2 minute trajectory for a male fly in a mixed-sex arena. The colored boxes indicate trajectory segments in (a). (c) (top) Behavior classifications for the 2 minute trajectory. A mark at t = 780 for the ‘chase’ row indicates that the fly was chasing at time t = 780. (bottom) Plots of translational and angular speed for a 30 second span of the trajectory (t = 780–810 s), superimposed over the behavior classifications. (d) Example behavioral vectors for female (left), male (center), and male fru1/fru1 (right) flies in single-sex trials. Each column corresponds to a fly, each row to a behavior (n = 78 (female), 108 (male), 40 ( fru1)). Color indicates the z-scored frequency (onsets per minute) for each behavior. (e) Accuracy of sex prediction from automatically-detected behaviors. The black bars indicate the cross-validation error of single-threshold classifiers based on frequency. The gray bars correspond to logistic regression classifiers from all eight (left) and the six locomotor (right) behaviors. The white bar shows the accuracy of classifying sex based on the image area of the fly (see Methods). (f) Accuracy of genotype prediction (wild type vs. fru1/fru1), as in (e).
Figure 4
Figure 4
Differences within and among individual flies. (a) The first and second halves of trajectories for three male and three female flies from the same trial. (b) Scatter plots of walking statistics from each individual fly in the first 15 minutes of its trajectory against the same statistics from the last 15 minutes of its trajectory for flies in all trial types (female n = 132, male n = 159). M = male, F = female, B = both male and female. Walking statistics examined were: (left) Mean speed in frames in which fly was classified as walking: r = 0.889, P < 2.2 × 10⁻¹⁶ (r, Pearson’s correlation coefficient; P, the probability that the null hypothesis of r non-positive is correct), (center) Fraction of frames fly is classified as walking: r = 0.689, P < 2.2× 10⁻¹⁶ (right) Mean duration of sequences of consecutive walking frames: r = 0.765, P < 2.2× 10⁻¹⁶. (c) Chasing behavior differences. We repeated the above procedure for chasing behavioral statistics: (left) Frequency with which the fly begins chasing another fly: r = 0.592, P = 3.89× 10⁻¹⁶, (center) frequency with which a fly is chased by another fly: r = 0.213, P = 1.54× 10-03, and (right) mean duration of chases: r = 0.054, P = 0.261.
Figure 5
Figure 5
Spatial analysis of social interactions. (a) Normalized histogram of inter-fly distances. We show a histogram of the distance to the nearest fly for each fly in each frame. Each line corresponds to a different condition, as indicated. For example, the line through red triangles indicates distance from a female (F) to the closest female (F) in a male-female (B) arena. The frequency was normalized both by the total number of counts and by the area of the bin. Each encounter was counted only once by ignoring all but the first frame in which both flies were stopped. The ‘synthetic’ condition shows a control where we decorrelated fly positions by staggering the trajectories in time, and collapsed data from all conditions. The lightly shaded regions indicate one standard deviation in normalized frequency, approximated by randomly splitting the flies into five groups. For comparison, the pink and blue tick marks indicate the mean fly widths and heights for female and male flies, respectively. (b) Histogram of the x,y relative position of one fly in the coordinate system of another at the closest point of an encounter. Each plot corresponds to a different social condition, as indicated. The white triangle in each plot shows the fixed position of the given fly. The pixel color indicates the frequency with which the closest fly is in the corresponding location bin. (c) Histogram of the x,y mutual position between fru1/fru1 males.

Comment in

  • The ethomics era?
    Reiser M. Reiser M. Nat Methods. 2009 Jun;6(6):413-4. doi: 10.1038/nmeth0609-413. Nat Methods. 2009. PMID: 19478800 No abstract available.

Similar articles

Cited by

References

    1. Wolf FW, Heberlein U. Invertebrate models of drug abuse. Journal of Neurobiology. 2003;54:161–178. - PubMed
    1. Guarnieri D, Heberlein U. Drosophila melanogaster, a genetic model system for alcohol research. International Review of Neurobiology. 2003;54:199–228. - PubMed
    1. Chan YB, Kravitz EA. Specific subgroups of FruM neurons control sexually dimorphic patterns of aggression in Drosophila melanogaster. Proceedings of the National Academy of Sciences. 2007;104:19577. - PMC - PubMed
    1. Hoyer SC, et al. Octopamine in Male Aggression of Drosophila. Current Biology. 2008 - PubMed
    1. Ho K, Sehgal A. Drosophila melanogaster: An insect model for fundamental studies of sleep. Methods Enzymol. 2005;393:772–793. - PubMed

Publication types

MeSH terms

LinkOut - more resources