. 2009 Jun;6(6):458-64.
doi: 10.1038/nmeth.1327. Epub 2009 May 3.

Tissue tectonics: morphogenetic strain rates, cell shape change and intercalation

Affiliations

Tissue tectonics: morphogenetic strain rates, cell shape change and intercalation

Guy B Blanchard et al. Nat Methods. 2009 Jun.

Abstract

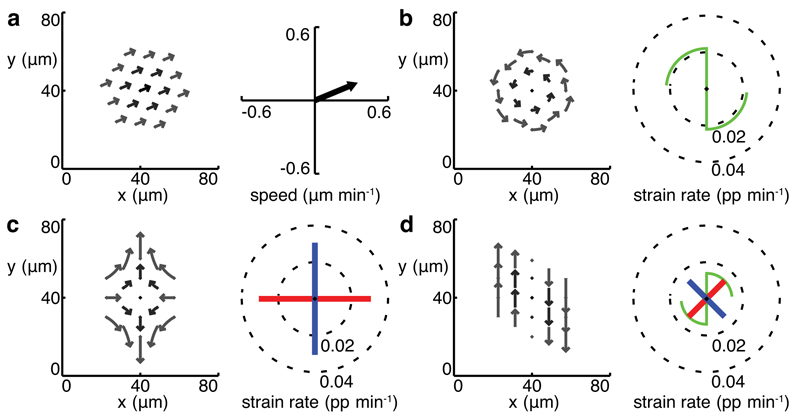
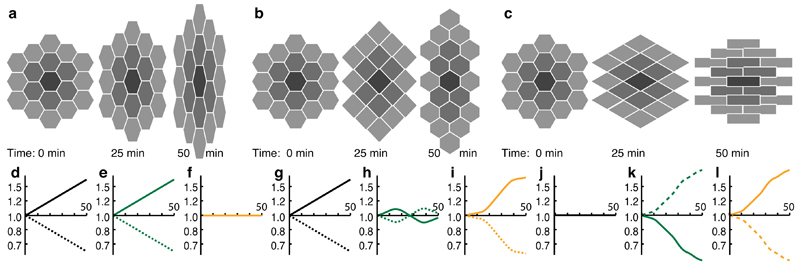
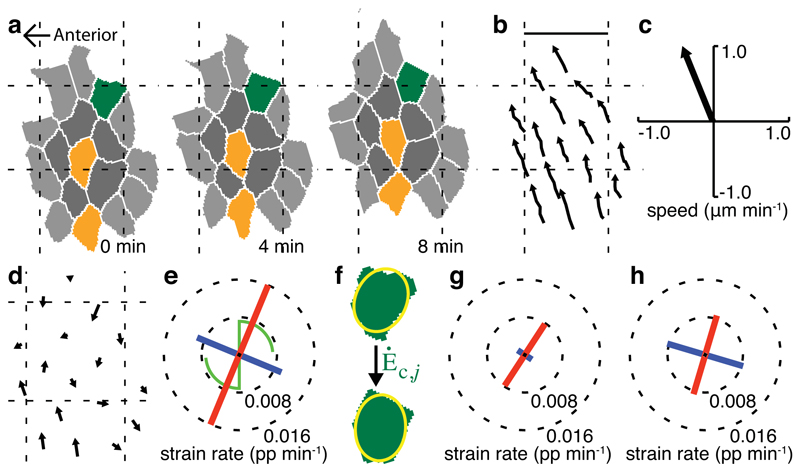
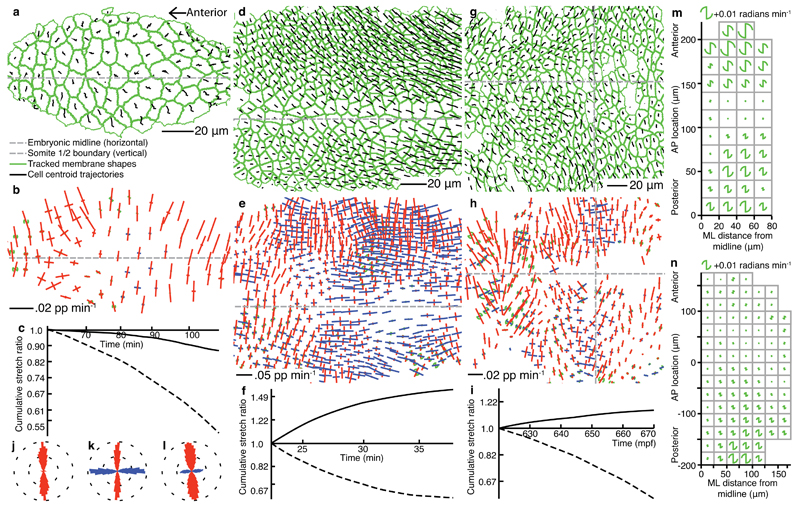
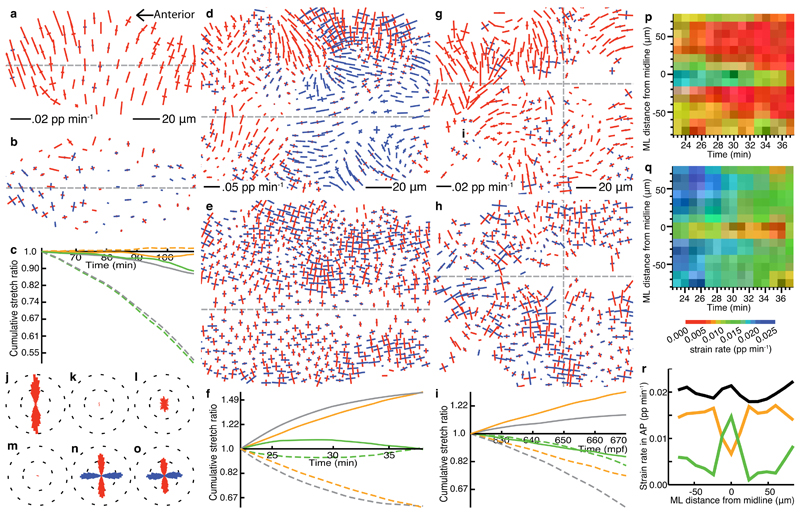
The dynamic reshaping of tissues during morphogenesis results from a combination of individual cell behaviors and collective cell rearrangements. However, a comprehensive framework to unambiguously measure and link cell behavior to tissue morphogenesis is lacking. Here we introduce such a kinematic framework, bridging cell and tissue behaviors at an intermediate, mesoscopic, level of cell clusters or domains. By measuring domain deformation in terms of the relative motion of cell positions and the evolution of their shapes, we characterized the basic invariant quantities that measure fundamental classes of cell behavior, namely tensorial rates of cell shape change and cell intercalation. In doing so we introduce an explicit definition of cell intercalation as a continuous process. We mapped strain rates spatiotemporally in three models of tissue morphogenesis, gaining insight into morphogenetic mechanisms. Our quantitative approach has broad relevance for the precise characterization and comparison of morphogenetic phenotypes.


Figures

Figure 1.
Figure 1.. Measuring tissue strain rates in simulated data.
(a)-(d) left panels trajectories, right panels domain translation (a) and tissue strain rates (b)-(d) for simulated domains (nc = 2, dt = 9 min). (a) the domain behaves as a rigid block translating with velocities uniform within the domain. (b) pure rotation. (c) balanced convergence and extension, or pure shear. (d) an equal combination of pure shear and rotation, or simple shear. Principal strain rates are represented by orthogonal line segments with length equal to strain rate amplitude (blue positive, red negative). Rotation is represented by a green scythe motif, with radius indicating radians per minute on the same scale as the strain rates. Blades point in the direction of rotation (anticlockwise in (b), clockwise in (d)).
Figure 2.
Figure 2.. Cellular simulations of tissue morphogenesis.
Three cellular scenarios are simulated in (a)-(c) demonstrating tissue outcomes for different combinations of cell shape change and cell intercalation. Focal cell is black, with first and second coronae of neighbours in dark and light gray, respectively. (d)-(f), (g)-(i) and (j)-(l) show cumulative stretch ratios on a log scale versus time in minutes for examples (a), (b) and (c) respectively. Cumulative stretch ratios in vertical (solid) and horizontal (dotted) orientations are plotted for tissue (d), (g), (j) in black, cell shape (e), (h), (k) in dark green and cell intercalation (f), (i), (l) in orange.
Figure 3.
Figure 3.. Measuring strain rates for a domain of zebrafish ectoderm.
(a) cell shapes and (b) cell centroid trajectories for a domain (nc = 2, dt = 4 min) are used to calculate strain rates. Cell colors in (a) show first (dark grey) and second (light grey) coronae of neighbours around the focal central cell, with examples of cell shape change (dark green) and intercalation (orange). Scale bar in (b) 25 µm. (c) average domain translation. (d) velocity field. (e) tissue strain and rotation rates. Strain rate line-segments and rotation rates are drawn as in Figure 1. (f) cell shapes are approximated to their best-fit ellipses and strain rates that must be applied to account for a cell’s shape evolution from t-dt to t+dt are calculated for all cells of the domain. (g) area-weighted average cell shape strain rates. (h) cell intercalation strain rates.
Figure 4.
Figure 4.. Tissue strain rate patterns in Drosophila and zebrafish ectoderm.
(a), (d), (g) tracked cell trajectories and cell shapes within curved layers taken through the apices of three different epithelial tissues imaged by 3D time-lapse confocal microscopy. (a)-(c),(j) Drosophila amnioserosa mid-way through dorsal closure (time is from the start of dorsal closure in (c)). (d)-(f),(k) Drosophila germband mid-way through germband extension (time is from the start of germband extension in (f)), with the left margin of the field of view approximately four cell diameters posterior to the cephalic furrow. (g)-(i),(l) zebrafish trunk neuroectoderm just prior to the onset of neurulation, starting at 10.2 hpf. Gaps indicate tracking ambiguities. (b),(e),(h), tissue strain rates. Colors of strain rates and rotations are as in Figure 1. Strain rate scale bars are shown. (c),(f),(i) cumulative tissue stretch ratios, integrated across AP (solid) and ML (dotted) orientations. (j)-(l) radial histograms (east-west is AP) of whole movie pooled strain rate orientations, weighted by their absolute magnitude. (m),(n) pooled rotation data from multiple aligned embryos (see Online Methods), summarized for squares of tissue for Drosophila germband (average over 5-20 min after the start of germband extension) and zebrafish trunk ectoderm (average over 560-610 mpf) respectively. Data on the left of each embryo has been mirrored onto the right-hand side. AP location of ~220 µm is the cephalic furrow in (m) and 0 µm is the somite 1/2 boundary in (n).
Figure 5.
Figure 5.. Cell shape and cell intercalation strain rate patterns in Drosophila and zebrafish ectoderm.
(a)-(o) are from the same movies represented in Fig. 4a-l, but here the first two panels of each column represent cell shape and cell intercalation strain rates respectively. (a)-(c),(j),(m) Drosophila amnioserosa, (d)-(f),(k),(n) Drosophila germband, (g)-(i),(l),(o) zerbrafish trunk neuroectoderm. (c), (f), (i), cumulative stretch ratios of cell shape (green), cell intercalation (orange) and total tissue (gray) plotted as in Figure 2. Whole movie pooled strain rate orientation histograms of cell shape (j)-(l) and intercalation (m)-(o). (p)-(r) average strain rates projected onto the AP (extension) axis for the epoch of germband extension shown in (l). (p) cell shape, (q) intercalation strain rates. (r) colors are as for cumulative stretch ratios.

References

    1. Keller R, et al. Mechanisms of convergence and extension by cell intercalation. Phil Trans Roy Soc B. 2000;355:897–922. - PMC - PubMed
    1. Bertet C, Sulak L, Lecuit T. Myosin-dependent junction remodelling controls planar cell intercalation and axis elongation. Nature. 2004;429:667–671. - PubMed
    1. Concha M, Adams RJ. Oriented cell divisions and cellular morphogenesis in the zebrafish gastrula and neurula: a time-lapse analysis. Development. 1998;125:983–994. - PubMed
    1. Neumann M, Affolter M. Remodelling epithelial tubes through cell rearrangements: from cells to molecules. EMBO reports. 2006;7:36–40. - PMC - PubMed
    1. Hutson MS, et al. Forces for morphogenesis investigated with laser microsurgery and quantitative modelling. Science. 2003;300:145–149. - PubMed

Publication types