. 2009 May;5(5):e1000407.
doi: 10.1371/journal.ppat.1000407. Epub 2009 May 1.

Helicobacter pylori usurps cell polarity to turn the cell surface into a replicative niche

Affiliations

Helicobacter pylori usurps cell polarity to turn the cell surface into a replicative niche

Shumin Tan et al. PLoS Pathog. 2009 May.

Abstract

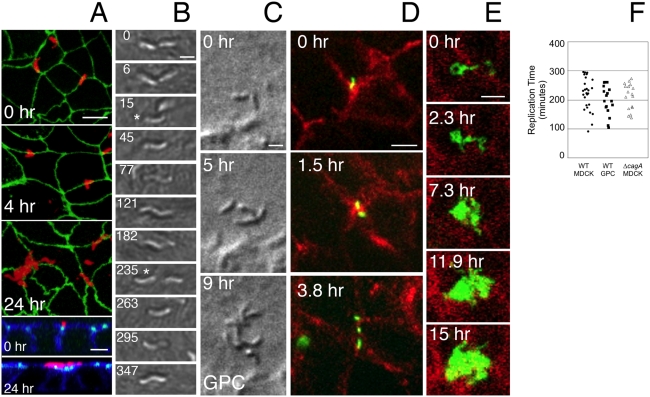
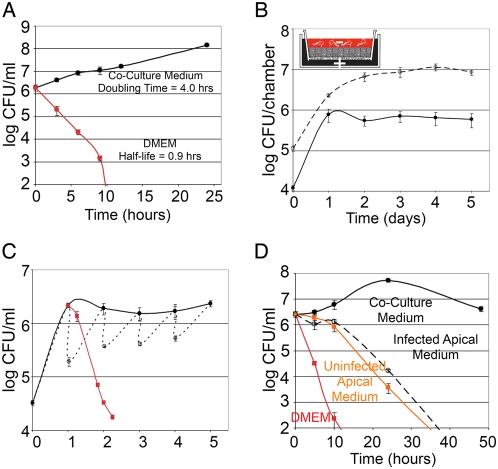
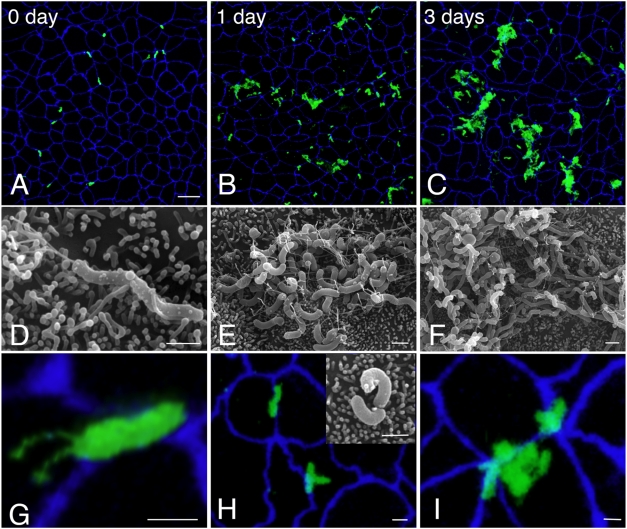
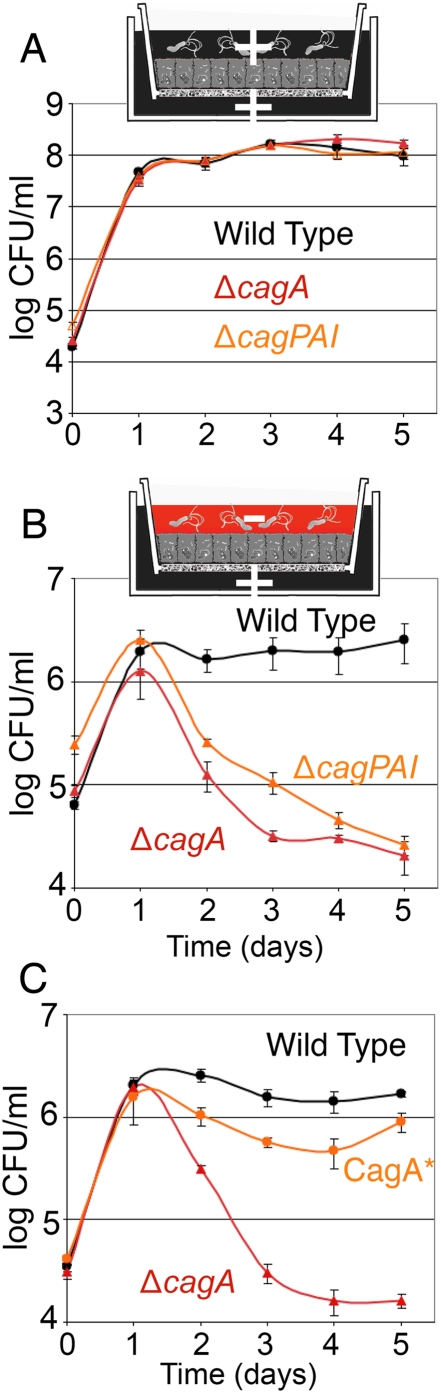
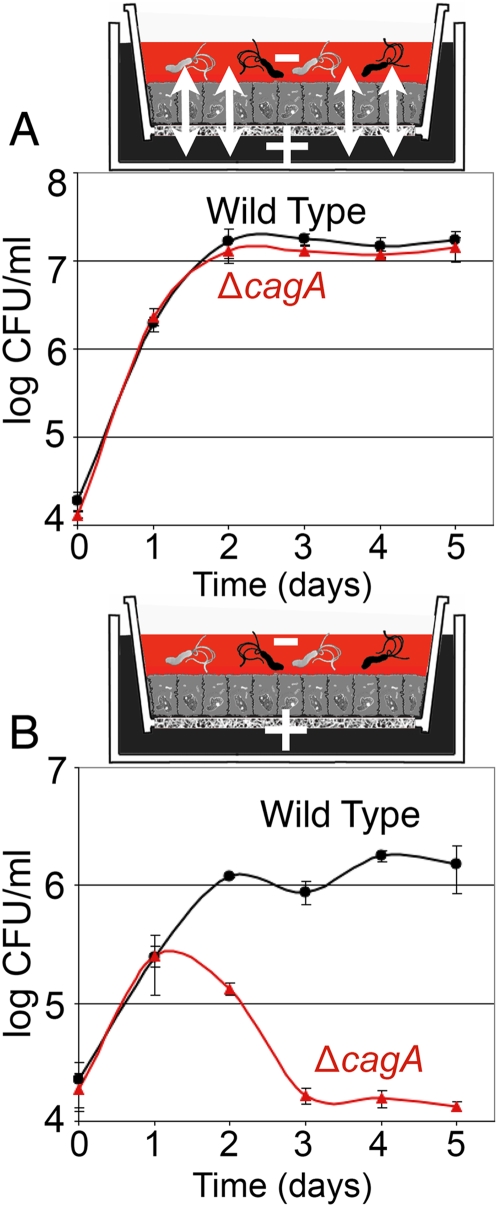
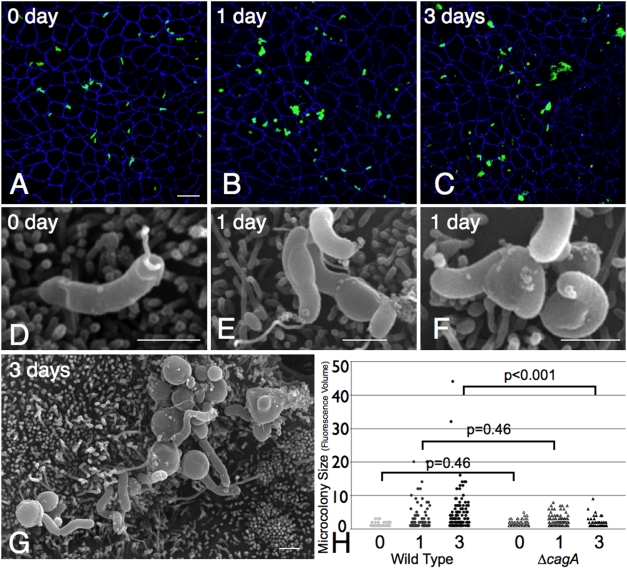
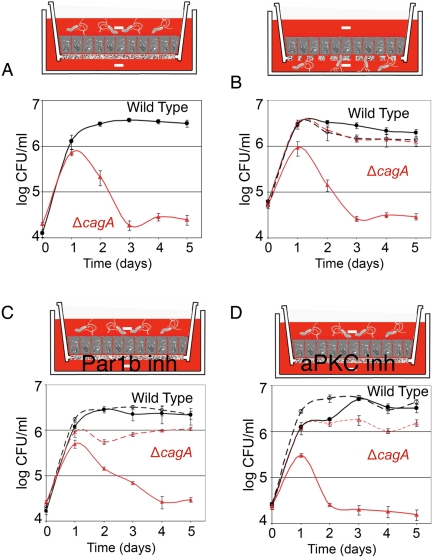
Helicobacter pylori (Hp) intimately interacts with the gastric epithelial surface and translocates the virulence factor CagA into host cells in a contact-dependent manner. To study how Hp benefits from interacting with the cell surface, we developed live-cell microscopy methods to follow the fate of individual bacteria on the cell surface and find that Hp is able to replicate and form microcolonies directly over the intercellular junctions. On polarized epithelia, Hp is able to grow directly on the apical cell surface in conditions that do not support the growth of free-swimming bacteria. In contrast, mutants in CagA delivery are defective in colonization of the apical cell surface. Hp perturbs the polarized epithelium in a highly localized manner, since wild-type Hp does not rescue the growth defect of the CagA-deficient mutants upon co-infection. CagA's ability to disrupt host cell polarity is a key factor in enabling colonization of the apical cell surface by Hp, as disruption of the atypical protein kinase C/Par1b polarity pathway leads to rescue of the mutant growth defect during apical infection, and CagA-deficient mutants are able to colonize the polarized epithelium when given access to the basolateral cell surface. Our study establishes the cell surface as a replicative niche and the importance of CagA and its effects on host cell polarity for this purpose.


Conflict of interest statement

The authors have declared that no competing interests exist.

Figures

Figure 1
Figure 1. Hp replicate on the cell surface.
(A) Confocal immunofluorescence time course of Hp attachment and microcolony formation on the cell surface. MDCK cells were infected for 5 minutes and washed (0 hr), and then incubated for times shown. Monolayers were stained with anti-Hp antibodies (red) and for the apical junctions (anti-ZO-1, green). Bottom panels show cross sections through the monolayer (also stained for f-actin in blue). Scale bars 5 µm. (B) DIC time-lapse of Hp replicating on the MDCK cell surface. Single bacteria were followed through 1.5 rounds of replication. Star indicates the bacterium of each pair being followed. Images from Video S1 aligned horizontally. Time in minutes is indicated. Scale bar 1 µm. (C) DIC time-lapse movie of Hp replicating on the cell surface of primary murine gastric epithelial cells (GPC) of pit lineage. Hp were attached near a cell junction at 0 hr and followed through 2 rounds of replication (see Video S2). Scale bar 1 µm. (D) Time-lapse fluorescence microscopy of GFP-Hp (green) replicating over the epithelial junctions of MDCK cells expressing RFP-E-cadherin (red). GFP-Hp shown in the top panel was filmed as it adhered to the cell surface, and followed for several hours (see Video S3). Scale bar 5 µm. (E) A longer time-lapse recording of cells infected as in (D), starting a day after initial infection (see Video S4). Scale bar 5 µm. (F) Hp replication rate on the surface of MDCK or Gastric Primary Cells (GPC). Hp were followed by DIC microscopy as in (B) and (C). Cycles of replication were noted by single frame analysis of the video recordings taken at 1–2 minute resolution. Points on the graph represent individual Hp that were followed over a replication cycle, collected from multiple experiments. Median rates of replication on the cell surface were 227, 196, and 220 minutes for WT on MDCK, WT on GPC, and ÄcagA on MDCK respectively. These were not significantly different from each other as determined by Mann-Whitney statistical test.
Figure 2
Figure 2. Hp grows on a polarized epithelium in conditions where free-swimming bacteria are killed.
(A) Hp growth in broth. Hp grown on blood agar plates were resuspended and inoculated into DMEM with FBS and Brucella broth (co-culture media) (black line) or into DMEM only (red line). Samples were taken over time and plated for colony forming unit (CFU) counts. (B–C) Hp growth in a Transwell system. To mimic tissue polarity during infection, polarized epithelial cells were grown on Transwell chambers as shown in the diagram. Co-culture media able to support the growth of cells and bacteria was placed only in the basal chamber (+). Hp were inoculated into the apical chamber in DMEM (−). (B) Bacterial counts of the cell-associated Hp population (dashed line), and simultaneously of the free-swimming population (solid line). (C) Bacteria counts from the free-swimming population sampled before media replacement daily (solid line), and counts before and after media change daily (dotted line). The red plot indicates counts from the free-swimming population removed from the apical chamber at day 1 post-infection, and incubated without host cells. (D) Conditioned media from the apical chamber does not support Hp growth. The media from the apical chamber was collected after 1 day of infection or from uninfected polarized monolayers, filtered, and then inoculated with plate-grown bacteria. As positive and negative controls, co-culture media or DMEM were inoculated with the same bacterial suspension. Samples were taken over time and plated for CFU counts.
Figure 3
Figure 3. Hp form microcolonies on the cell surface in nutrient-poor conditions.
(A–C) Low magnification 3D confocal images of WT colonizing the cell surface of polarized MDCK cells in the Transwell system. Cells were infected for 5 minutes and then unattached Hp washed away and media replaced (0 day). Bacteria are visualized with anti-Hp antibodies (green) and cell junctions are stained blue (anti-ZO-1). Scale bar 10 µm. (D–F) Scanning electron microscopy (SEM) images of WT colonizing the cell surface of polarized MDCK cells, infected as above. Scale bars 1 µm. (G–I) High magnification 3D confocal images from Transwell system infections as above, showing relation of adhered WT (green) to epithelial junctions (blue). Inset in (H) shows replicating WT as visualized by SEM. Scale bars 1 µm.
Figure 4
Figure 4. CagA is critical for Hp colonization of the apical cell surface.
(A) ΔcagA, ΔcagPAI, and WT grow equally well in the presence of nutrients. Polarized cells on Transwell filters were infected with WT, ΔcagA or ΔcagPAI. In these experiments, co-culture media (+) was added both apically and basally. Samples were taken from the apical chamber before wash daily, and plated for CFU counts. (B,C) CagA is important in enabling Hp colonization of the apical cell surface. Using the Transwell system, cells were infected with strains indicated, and co-culture media added only to the basal chamber (+). DMEM was added to the apical chamber (−). Samples were taken and plated as in (A). CagA* was reconstituted from ΔcagA, produces an equivalent amount of CagA protein as WT, and delivers CagA to host cells (see Figure S3).
Figure 5
Figure 5. Effects of CagA are highly localized.
(A) In the presence of nutrients, WT and ΔcagA grow equally well in a mixed infection. WT and ΔcagA were mixed together, and the mixture used to infect a monolayer on a Transwell filter previously fixed to induce leakiness (see Figure S1C). Samples were taken from the apical chamber before wash daily and plated on both non-selective and selective plates to differentiate WT and ΔcagA for CFU counts. (B) WT does not rescue ΔcagA in a mixed infection on an intact, polarized monolayer. The same mixture of WT and ΔcagA as in (A) was allowed to infect an intact polarized monolayer, and samples from the apical chamber plated daily as in (A).
Figure 6
Figure 6. ΔcagA form aborted microcolonies on the apical cell surface.
(A–C) Low magnification 3D confocal images of ΔcagA colonizing the cell surface of polarized MDCK cells in the Transwell system, as done for WT in Figure 3. Cells were infected for 5 minutes and then unattached ΔcagA washed away and media replaced (0 day). Bacteria are visualized with anti-Hp antibodies (green) and cell junctions are stained blue (anti-ZO-1). Scale bar 10 µm. (D–G) SEM images of ΔcagA colonizing the cell surface of polarized MDCK cells, infected as above. Scale bars 1 µm. (H) Quantitative data of WT (circles) and ΔcagA (triangles) microcolony sizes over time (0, 1 and 3 days), determined by fluorescence volume measured with Volocity software from multiple 3D confocal images. Each point on the graph represents a microcolony. P-values were obtained with a Mann-Whitney statistical test.
Figure 7
Figure 7. Polarity disruption is involved in Hp colonization of the apical cell surface.
(A) Hp can acquire nutrients for growth directly from the epithelium. Polarized cells on Transwell filters were infected with WT or ΔcagA apically, in the presence of plain DMEM in both apical and basal chambers. Samples were taken from the apical chamber before wash daily, and plated for CFU counts. (B) The apical vs. basolateral cell surfaces are intrinsically different in their ability to support Hp growth. Polarized cells on Transwell filters with larger 3 µm pores were infected with WT or ΔcagA either from the apical (solid lines) or basal side (dashed lines), in the presence of plain DMEM in both chambers. Samples from the appropriate chamber were taken before wash daily and plated for CFU counts. (C,D) Inhibition of atypical protein kinase C aPKC or Par1b rescues ΔcagA growth. Polarized monolayers were infected apically as in (A). Solid lines indicate conditions with plain DMEM in both apical and basal chambers. Dashed lines indicate conditions with 20 µM hymenialdisine, a Par1b inhibitor, added to DMEM in the basal chamber (panel C), or conditions with a specific aPKCζ pseudosubstrate inhibitor (10 µM) added to DMEM in the basal chamber (panel D).

References

    1. Worlitzsch D, Tarran R, Ulrich M, Schwab U, Cekici A, et al. Effects of reduced mucus oxygen concentration in airway Pseudomonas infections of cystic fibrosis patients. J Clin Invest. 2002;109:317–325. - PMC - PubMed
    1. Steer HW. Surface morphology of the gastroduodenal mucosa in duodenal ulceration. Gut. 1984;25:1203–1210. - PMC - PubMed
    1. Hendrixson DR, St Geme JW., 3rd The Haemophilus influenzae Hap serine protease promotes adherence and microcolony formation, potentiated by a soluble host protein. Mol Cell. 1998;2:841–850. - PubMed
    1. Phillips AD, Frankel G. Intimin-mediated tissue specificity in enteropathogenic Escherichia coli interaction with human intestinal organ cultures. J Infect Dis. 2000;181:1496–1500. - PubMed
    1. Hicks S, Frankel G, Kaper JB, Dougan G, Phillips AD. Role of intimin and bundle-forming pili in enteropathogenic Escherichia coli adhesion to pediatric intestinal tissue in vitro. Infect Immun. 1998;66:1570–1578. - PMC - PubMed

Publication types

Substances