. 2009 May;5(5):e1000405.
doi: 10.1371/journal.ppat.1000405. Epub 2009 May 1.

Differential modulation of TNF-alpha-induced apoptosis by Neisseria meningitidis

Affiliations

Differential modulation of TNF-alpha-induced apoptosis by Neisseria meningitidis

Ala-Eddine Deghmane et al. PLoS Pathog. 2009 May.

Abstract

Infections by Neisseria meningitidis show duality between frequent asymptomatic carriage and occasional life-threatening disease. Bacterial and host factors involved in this balance are not fully understood. Cytopathic effects and cell damage may prelude to pathogenesis of isolates belonging to hyper-invasive lineages. We aimed to analyze cell-bacteria interactions using both pathogenic and carriage meningococcal isolates. Several pathogenic isolates of the ST-11 clonal complex and carriage isolates were used to infect human epithelial cells. Cytopathic effect was determined and apoptosis was scored using several methods (FITC-Annexin V staining followed by FACS analysis, caspase assays and DNA fragmentation). Only pathogenic isolates were able to induce apoptosis in human epithelial cells, mainly by lipooligosaccharide (endotoxin). Bioactive TNF-alpha is only detected when cells were infected by pathogenic isolates. At the opposite, carriage isolates seem to provoke shedding of the TNF-alpha receptor I (TNF-RI) from the surface that protect cells from apoptosis by chelating TNF-alpha. Ability to induce apoptosis and inflammation may represent major traits in the pathogenesis of N. meningitidis. However, our data strongly suggest that carriage isolates of meningococci reduce inflammatory response and apoptosis induction, resulting in the protection of their ecological niche at the human nasopharynx.


Conflict of interest statement

The authors have declared that no competing interests exist.

Figures
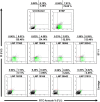
Figure 1
Figure 1. Flow cytometric analysis of Hec-1-B epithelial cells following meningococcal infection.
Confluent Hec-1-B cell monolayers were infected with the indicated pathogenic ST-11 or carriage isolates for 9 h or left uninfected (control). A positive control for apoptosis, cells were treated for the same period with 1 µM STRP. After washing and Annexin V– and PI-staining, cells were analyzed by flow cytometry. Outset numbers in the top of each plot, show percentages of cells in the quadrant. Early apoptotic cells (Annexin V+/PI, green population), dead cells (Annexin V/PI+, red population) and late apoptotic/necrotic cells (Annexin V+/PI+, grey population). Data are representative of at least three independent experiments with similar results.
Figure 2
Figure 2. Analysis of apoptotic Hec-1-B cells by immunofluorescence microscopy and caspase-3 activity.
(A) Hec-1-B epithelial cells were infected with the pathogenic isolate LNP19995 (Red) or the carriage isolate LNP21019 (Red). As controls, cells were left uninfected (negative control) or treated with STRP (positive control). Nine hours later, cells were fixed and stained with FITC-Annexin V (green) and DAPI (nuclei staining, blue) and observed under fluorescence microscope. Left panels represent images taken with low magnification (×20) and right panel are merged images taken with high magnification (×100). Green arrows indicate Annexin V positive cells. Red arrowheads indicate bacteria. BF: Bright field. Scale bars 20 µm and 10 µm for magnifications ×20 and ×100, respectively are shown. (B) The pathogenic isolate LNP19995 but not the carriage isolate LNP21019 activates Caspases-3 in Hec-1-B epithelial cells. Cells were infected with either isolate, treated with STRP (positive control) or left untreated (negative control). Cells were harvested 9 h post-infection, lysed and the caspase-3 activity was determined. The specificity of activity was monitored using caspase-3 specific inhibitor DEVD added 2 h prior to infection. The activity is expressed as arbitrary fluorescence units/mg protein/h. All samples were run in triplicate in each experiment. The results shown are representative of three independent experiments, and are expressed as mean±SD (* indicates P<0.001).
Figure 3
Figure 3. Effect of pili and capsule on apoptosis.
(A) Hec-1-B epithelial cells were infected for 9 h with the pathogenic isolate LNP19995 (WT), or the isogenic mutants NM0706 (non-piliated) and NM0707 (unencapsulated), the non-pathogenic isolate LNP21019, or the unencapsulated isogenic mutant NM0813. In some experiments, the non piliated mutant NM0706 was directly centrifuged on cells or cells were treated with 10 µM cytochalasin D prior to infection with the WT strain. Cells were harvested, stained with FITC-Annexin V and PI, and submitted to FACS analysis. Inset numbers indicate the percentage of apoptotic population (green population). (B) Quantification of the results shown in A from three individual experiments. The data in (A) are from one of three independent experiments that yielded similar results and values in (B) are the mean±SD.
Figure 4
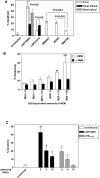
Figure 4. LOS and PorB are required for induction of apoptotic cell death by the pathogenic isolate LNP19995.
(A) Hec-1-B cells were infected with live or killed LNP19995 and LNP21019 or the isogenic mutants of the isolate LNP19995 defective in PorB (NM0401), LOS (Z0305) or both PorB and LOS (NM0705). Apoptosis was measured by FITC-Annexin V/PI double staining after 9 h of infection. Uninfected cells were used as negative control. The data are representative of three different experiments, and error bars represent the standard deviations of triplicate samples. (B) Purified LOS induces apoptosis in a dose-dependent manner. Cells were treated at different concentrations with LOS for 9 h in absence (−) or presence (+) of 1 µM polymixin B (PMB). The percentage of apoptotic cells was determined using the ApoPercentage kit. Untreated (MOI = 0) cells served as the negative control. Numbers in the bottom of histograms indicate the MOIs corresponding to the amount of LOS used. (C) The non-pathogenic isolate LNP21019 actively inhibits the apoptosis induced by LOS or the pathogenic isolate LNP19995. Cells infected with LNP19995 at MOI 10 (dark bars) or equivalent amounts of LOS purified from LNP21019 (grey bars) were co-challenged with an increasing MOI of the isolate LNP21019. After 9 h, cells were harvested and stained with FITC-Annexin V and PI. Numbers under histograms indicate LNP21019 to cell ratio. The data are the mean±SD of three separate experiments (** indicates P<0.01 and * indicates P<0.05).
Figure 5
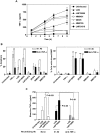
Figure 5. Analysis of TNF-α secretion and bioactivity.
(A) Quantitation of TNF-α in culture supernatants of Hec-1-B cells infected with the indicated strains. Cells were infected with the indicated strains, treated with LOS, or left untreated, and culture supernatants were collected at 9 h post-infection and assayed for TNF-α secretion by ELISA. Shown are mean±SD of two representative experiments. (B) Left panel: Competitive inhibition of apoptosis by an anti–TNF-α neutralizing antibody. Hec-1-B cells were infected, or treated with TNF-α for 9 h in presence of either an anti–TNF-α neutralizing antibody (closed bars) or an isotype-matched irrelevant antibody (Irr Ab, open bars). Cells were harvested and stained with FITC-Annexin V and PI before FACS analysis. Data are the mean±SD of three independent experiments. Right panel: LNP19995 affects the mitochondrial membrane potential (MMP) in PorB-dependent, TNF-α-independent manner. Cells were infected as described previously. After 9 h of incubation, cells were harvested and the mitochondrial membrane potential damage was performed using DiIC1(5) dye staining and FACS analysis. Acquisition was performed on 10,000 events. Measurements are representative of three independent experiments. (C) The non-pathogenic carriage isolate LNP21019 altered TNF-α bioactivity. Culture supernatants from Hec-1-B cells at 9 h after infection with LNP19995, LNP21019 or LOS treatment, were assayed for TNF-α bioactivity by measuring cytotoxicity for L929 mouse fibroblasts. Dilutions of recombinant human TNF-α (rhTNF-α) were used as internal standard. The specificity of TNF-α bioactivity was monitored by incubation of Hec-1-B cultures in presence of specific anti–TNF-α neutralizing or irrelevant (Irr) antibodies. Data are mean±SD from three independent experiments. The P values are shown.
Figure 6
Figure 6. Differential cell surface expression of TNF-RI upon infection with pathogenic and carriage isolates.
(A) The non-pathogenic carriage isolate specifically alters surface expression of TNF-RI. Hec-1-B cells were either left untreated in culture medium alone, treated with TNF-α, or incubated with bacteria for 9 h. Cells were harvested and incubated with anti-TNF-RI or anti-TNF-RII specific antibodies, followed by labeling with FITC-conjugated secondary Abs. Samples were washed and fixed in 2.5% paraformaldehyde before FACS analysis under non-permeabilizing conditions. Results are expressed as the percentages of positive cells stained with the specific antibody relative to irrelevant antibody derived from 10,000 events and are indicated in each panel. The solid open histograms, unstained cells; dashed histograms, cells stained with an irrelevant isotype-matched antibody; the grey filled histograms, cells stained with specific antibody. The data shown are representative of three separate experiments. (B) Immunofluorescence analysis of TNF-RI surface expression. Cells adhering to tissue culture coverslips were incubated with TNF-α or infected with GFP- bacteria (green) for 9 h. Cells were then fixed and stained for TNF-RI (Red) and with DAPI to visualize nuclei (blue). Labeled cells were examined under a digital immunofluorescence microscope using low (×20, upper panel) or high (×100, lower panel) magnifications. Green arrows and asterisks indicate bacteria and nuclei, respectively. Scale Bars are 20 µm and 10 µm for magnifications ×20 and ×100, respectively. (C) Competitive inhibition of apoptosis by mAb to TNF-RI. Hec-1-B cells were infected or treated with TNF-α for 9 h in absence or presence of mAbs to either TNF-RI or TNF-RII or an irrelevant antibody at a final concentration of 20 µg/ml. Cells were then assayed for apoptosis using ApoPercentage kit. Values shown are the mean±SD of three independent experiments.
Figure 7
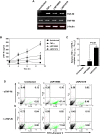
Figure 7. Analysis of transcription and shedding of TNF-RI.
(A) RT-PCR analysis of TNFRI and TNFRII expression. Hec-1-B cells were incubated in medium alone (uninfected), stimulated with TNF-α or infected with LNP19995 (pathogenic) or LNP21019 (carriage) isolates for 9 h. Total RNAs were isolated and equal amounts were analyzed by RT-PCR using TNF-RI, TNF-RII and β-actin specific primers. The data shown are from one of two independent experiments that yielded similar results. (B) Levels of soluble TNF-RI (sTNF-RI) in supernatants from uninfected or infected cells. Supernatants were cleared from bacteria and levels of sTNF-RI were determined by ELISA as described in Materials and Methods. Shown are mean±SD of triplicate values from one representative experiment of two. (C) Concentration of TNF-α bound to sTNF-RI (representative for TNF-α-sTNF-RI complexes) in cultures of Hec-1-B uninfected (control) or cells infected with LNP19995 or LNP21019. TNF-α-sTNF-RI complexes were assayed by mixed ELISA (see Materials and Methods) of supernatants harvested 9 h after infection. The data presented are mean±SD of three independent experiments. (D) Soluble TNF-RI (sTNF-RI) inhibits apoptosis induced by LNP19995 isolate. Cells were incubated alone or infected with either LNP19995 or LNP21019 for 9 h in the presence or in the absence of 250 pg/ml of sTNF-RI. After staining with FITC-Annexin V and PI, apoptotic cells were analyzed by FACS. Inset numbers represent the percentage of each population in the quadrants. Data are representative of two independent experiments which yielded similar results.

References

    1. van Deuren M, Brandtzaeg P, van der Meer JW. Update on meningococcal disease with emphasis on pathogenesis and clinical management. Clin Microbiol Rev. 2000;13:144–166, table of contents. - PMC - PubMed
    1. Klein NJ, Ison CA, Peakman M, Levin M, Hammerschmidt S, et al. The influence of capsulation and lipooligosaccharide structure on neutrophil adhesion molecule expression and endothelial injury by Neisseria meningitidis. J Infect Dis. 1996;173:172–179. - PubMed
    1. Virji M, Kayhty H, Ferguson DJ, Alexandrescu C, Heckels JE, et al. The role of pili in the interactions of pathogenic Neisseria with cultured human endothelial cells. Mol Microbiol. 1991;5:1831–1841. - PubMed
    1. Mercier JC, Beaufils F, Hartmann JF, Azema D. Hemodynamic patterns of meningococcal shock in children. Crit Care Med. 1988;16:27–33. - PubMed
    1. Virji M, Makepeace K, Ferguson DJ, Achtman M, Moxon ER. Meningococcal Opa and Opc proteins: their role in colonization and invasion of human epithelial and endothelial cells. Mol Microbiol. 1993;10:499–510. - PubMed

Publication types

MeSH terms

Substances