. 2009 May;5(5):e1000376.
doi: 10.1371/journal.pcbi.1000376. Epub 2009 May 1.

Prediction of protein binding regions in disordered proteins

Affiliations

Prediction of protein binding regions in disordered proteins

Bálint Mészáros et al. PLoS Comput Biol. 2009 May.

Abstract

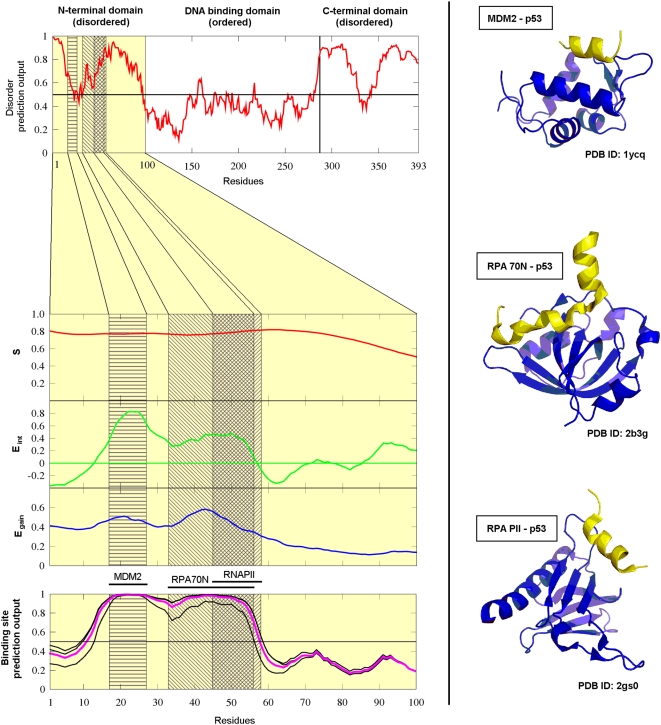
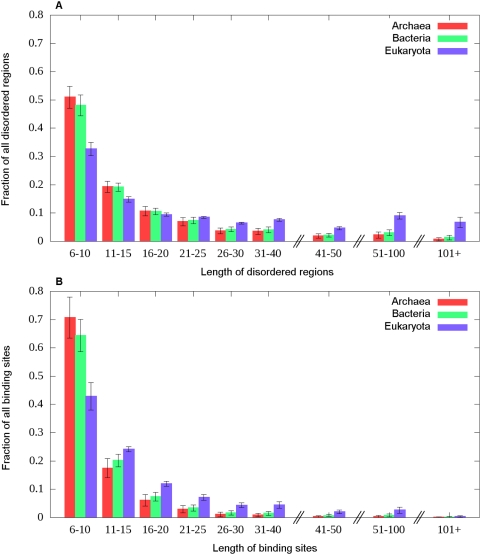
Many disordered proteins function via binding to a structured partner and undergo a disorder-to-order transition. The coupled folding and binding can confer several functional advantages such as the precise control of binding specificity without increased affinity. Additionally, the inherent flexibility allows the binding site to adopt various conformations and to bind to multiple partners. These features explain the prevalence of such binding elements in signaling and regulatory processes. In this work, we report ANCHOR, a method for the prediction of disordered binding regions. ANCHOR relies on the pairwise energy estimation approach that is the basis of IUPred, a previous general disorder prediction method. In order to predict disordered binding regions, we seek to identify segments that are in disordered regions, cannot form enough favorable intrachain interactions to fold on their own, and are likely to gain stabilizing energy by interacting with a globular protein partner. The performance of ANCHOR was found to be largely independent from the amino acid composition and adopted secondary structure. Longer binding sites generally were predicted to be segmented, in agreement with available experimentally characterized examples. Scanning several hundred proteomes showed that the occurrence of disordered binding sites increased with the complexity of the organisms even compared to disordered regions in general. Furthermore, the length distribution of binding sites was different from disordered protein regions in general and was dominated by shorter segments. These results underline the importance of disordered proteins and protein segments in establishing new binding regions. Due to their specific biophysical properties, disordered binding sites generally carry a robust sequence signal, and this signal is efficiently captured by our method. Through its generality, ANCHOR opens new ways to study the essential functional sites of disordered proteins.


Conflict of interest statement

The authors have declared that no competing interests exist.

Figures

Figure 1
Figure 1. The construction of the ANCHOR prediction method demonstrated on the N-terminal domain of human p53.
Left: IUPred prediction score for the full length human p53 (top) and S, Eint and Egain calculated for the disordered N terminal domain of human p53 (middle). Grey boxes show the three binding sites with the overlap of the RPA70N and RNAPII binding sites shown in dark grey. The outputs of the three individually optimized predictors are shown in black and their average, the final prediction score is shown in purple (bottom). Right: PDB structures of the binding sites in the N-terminal region of p53 (yellow) complexed with the respective partners (blue): MDM2 (top, PDB ID: 1ycq [57]), RPA 70N (middle, PDB ID: 2b3g [58]) and RNA PII (bottom, PDB ID: 2gs0 [59]).
Figure 2
Figure 2. ROC curves obtained during the testing of ANCHOR.
ROC curves of the predictor with parameter sets optimized on each of the three training subsets and evaluated on the respective testing subsets are shown with red, green and blue lines. The line with unity slope corresponding to random prediction is also shown. The vertical line corresponds to FPR = 0.05, where the final predictor (the average of these three) is used.
Figure 3
Figure 3. The distinct amino acid composition of short disordered binding sites.
The average amino acid composition of the interacting parts of the short disordered binding sites compared to the average amino acid composition of (A) the globular proteins dataset, (B) the disordered proteins dataset and (C) the interacting parts of the shorter chains of the ordered complexes. Amino acids are arranged according to increasing hydrophobicity.
Figure 4
Figure 4. Secondary structure distributions in the short disordered binding site dataset.
Fraction of amino acids in different secondary structures in the disordered chains of the complexes. The three groups denote the fractions calculated on all the residues in the PDB structures, only the interacting ones and the ones correctly identified by the predictor.
Figure 5
Figure 5. Prediction accuracies and segmentation for the short and long disordered binding sites.
(A) The distribution of the number of binding segments predicted in short (white bars) and long (black bars) binding sites. It shows the segmented nature of longer binding sites. (B) The distribution of the fraction of correctly recovered interacting residues in both the short (white bars) and long (black bars) disordered binding sites.
Figure 6
Figure 6. ANCHOR prediction for human p27.
Top: Number of atomic contacts (green) and prediction output (blue) and for the N-terminal binding region of human p27. “D1”and “D2” denote the two strongly interacting domains (red boxes) and “LH” denotes the weakly interacting linker domain between them (yellow box). Bottom: Crystal structure of human p27 (red and yellow) complexed with CDK2 (magenta) and Cyclin A (blue) (PDB ID: 1jsu [62]). Red parts denote regions that are predicted to bind by the predictor. These regions correspond to the experimentally verified strongly binding regions of p27. The figure was generated by PyMOL.
Figure 7
Figure 7. ANCHOR prediction for human WASp.
Red bars mark known interaction sites, green box marks the globular WH1 domain, blue boxes mark the GBD and VCA domains. Light red boxes indicate the regions with putative SH3 domain interaction sites.
Figure 8
Figure 8. Fraction of disordered and disordered binding site residues in complete proteomes.
The number of amino acids in disordered binding sites divided by the number of amino acids in disordered regions plotted as a function of the number of amino acids in disordered regions divided by the total number of residues in the proteome of the organism for the 736 complete proteomes deposited in the SwissProt database, colored according to the three kingdoms of life. The outlying points are marked with the name of the corresponding organism.
Figure 9
Figure 9. Length distribution of disordered and disordered binding sites in complete proteomes.
The length distribution of (A) the disordered protein segments determined by IUPred and (B) predicted disordered binding sites determined by ANCHOR for the 736 complete proteomes available, grouped according to the three kingdoms of life.

References

    1. Wright PE, Dyson HJ. Intrinsically unstructured proteins: re-assessing the protein structure-function paradigm. J Mol Biol. 1999;293:321–331. - PubMed
    1. Dyson HJ, Wright PE. Intrinsically unstructured proteins and their functions. Nat Rev Mol Cell Biol. 2005;6:197–208. - PubMed
    1. Dunker AK, Lawson JD, Brown CJ, Williams RM, Romero P, et al. Intrinsically disordered protein. J Mol Graph Model. 2001;19:26–59. - PubMed
    1. Tompa P. Intrinsically unstructured proteins. Trends Biochem Sci. 2002;27:527–533. - PubMed
    1. Dunker AK, Obradovic Z, Romero P, Garner EC, Brown CJ. Intrinsic protein disorder in complete genomes. Genome Inform Ser Workshop Genome Inform. 2000;11:161–171. - PubMed

Publication types

Substances