. 2009 May;5(5):e1000382.
doi: 10.1371/journal.pcbi.1000382. Epub 2009 May 1.

A differential wiring analysis of expression data correctly identifies the gene containing the causal mutation

Affiliations

A differential wiring analysis of expression data correctly identifies the gene containing the causal mutation

Nicholas J Hudson et al. PLoS Comput Biol. 2009 May.

Abstract

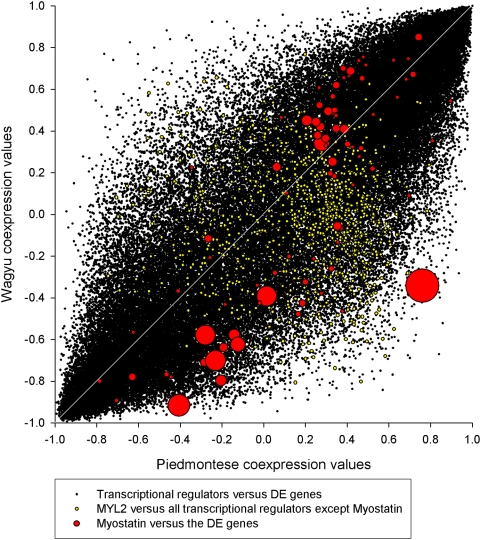
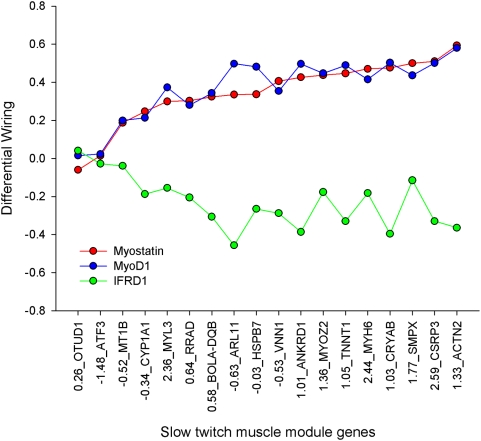
Transcription factor (TF) regulation is often post-translational. TF modifications such as reversible phosphorylation and missense mutations, which can act independent of TF expression level, are overlooked by differential expression analysis. Using bovine Piedmontese myostatin mutants as proof-of-concept, we propose a new algorithm that correctly identifies the gene containing the causal mutation from microarray data alone. The myostatin mutation releases the brakes on Piedmontese muscle growth by translating a dysfunctional protein. Compared to a less muscular non-mutant breed we find that myostatin is not differentially expressed at any of ten developmental time points. Despite this challenge, the algorithm identifies the myostatin 'smoking gun' through a coordinated, simultaneous, weighted integration of three sources of microarray information: transcript abundance, differential expression, and differential wiring. By asking the novel question "which regulator is cumulatively most differentially wired to the abundant most differentially expressed genes?" it yields the correct answer, "myostatin". Our new approach identifies causal regulatory changes by globally contrasting co-expression network dynamics. The entirely data-driven 'weighting' procedure emphasises regulatory movement relative to the phenotypically relevant part of the network. In contrast to other published methods that compare co-expression networks, significance testing is not used to eliminate connections.


Conflict of interest statement

The authors have declared that no competing interests exist.

Figures

Figure 1
Figure 1. The design of the microarray experiment.
Within each cross symbols with the same number indicate samples derived from the same individual animal.
Figure 2
Figure 2. MA plot.
Genes expressed more highly in the Wagyu cross are on the bottom, and genes expressed more highly in the Piedmontese cross are on the top. Regulators are denoted by triangles. MYL2 (slow twitch muscle structural protein) is the most differentially expressed gene. CSRP3 is the most differentially expressed regulator. Myostatin is neither abundant nor differentially expressed.
Figure 3
Figure 3. Expression profiles of myostatin and MYL2 in Piedmontese and Wagyu crosses.
Myostatin is not differentially expressed, but it is highly differentially wired to the highly DE MYL2.
Figure 4
Figure 4. The co-expression relationships between the 920 transcriptional regulators and the 85 DE genes.
The red circles represent the co-expression relationships of myostatin to the 85 DE genes, with circle size corresponding to the PIF of the DE gene represented at that particular co-expression intersection (DW). Myostatin is highly DW (as represented by long perpendicular distances from the diagonal) to the highest PIF genes (largest red circles). This dynamic underpins myostatin's exceptional RIF. The density of all points is highest at the extreme co-expression range (i.e., +1, +1 and −1, −1) and lowest for a complete reversal (i.e., +1, −1 and −1, +1).
Figure 5
Figure 5. The relationship between regulatory impact factor and differential expression.
The DEs of the 920 regulators are plotted against their respective RIFs (mean dot Eq4+Eq5). Myostatin, indicated by a red dot, is awarded the highest RIF despite not being DE.
Figure 6
Figure 6. The P×H v W×H “perturbation matrix.”
We applied Permut Matrix's hierarchical clustering algorithm to both rows (920 regulators) and columns (85 DE genes). A subset of the full matrix including the high phenotypic impact slow twitch module (blue line) and the major high impact transcriptional regulator circuit (red line). The scale is −1.53 (bright green) to +1.53 (bright red), with 0 being black.
Figure 7
Figure 7. The basis of an edge in a co-differential wiring network.
Myostatin, MyoD1 and IFRD1 are highly co-differentially wired across the 85 DE genes (correlation coefficients >0.9 or <−0.9). Here their respective relationships are visualised against only those 18 DE genes that cluster into the slow twitch Permut module, but the relationship holds for all 85 DE genes.
Figure 8
Figure 8. The DE and differential hubbing of all 11,057 genes.
While the extremes of the DH axis enriched for transcriptional regulators in general, myostatin is neither DH nor DE.

References

    1. Isalan M, Lemerle C, Michalodimitrakis K, Horn C, Beltrao P, et al. Evolvability and hierarchy in rewired bacterial gene networks. Nature. 2008;452:840–845. - PMC - PubMed
    1. Pimanda JE, Ottersbach K, Knezevic K, Kinston S, Chan WY, et al. Gata2, Fli1, and Scl form a recursively wired gene-regulatory circuit during early hematopoietic development. Proc Natl Acad Sci U S A. 2007;104:17692–17697. - PMC - PubMed
    1. Wiedemeyer R, Brennan C, Heffernan TP, Xiao Y, Mahoney J, et al. Feedback circuit among INK4 tumor suppressors constrains human glioblastoma development. Cancer Cell. 2008;13:355–364. - PMC - PubMed
    1. Hobert O. Gene regulation by transcription factors and microRNAs. Science. 2008;319:1785–1786. - PubMed
    1. Blais A, Dynlacht BD. Constructing transcriptional regulatory networks. Genes Dev. 2005;19:1499–1511. - PubMed

Publication types