Comparative Study
. 2009;4(5):e5430.
doi: 10.1371/journal.pone.0005430. Epub 2009 May 4.

Comparison of T cell receptor-induced proximal signaling and downstream functions in immortalized and primary T cells

Affiliations
Comparative Study

Comparison of T cell receptor-induced proximal signaling and downstream functions in immortalized and primary T cells

Rebekah R Bartelt et al. PLoS One. 2009.

Abstract

Background: Human T cells play an important role in pathogen clearance, but their aberrant activation is also linked to numerous diseases. T cells are activated by the concurrent induction of the T cell receptor (TCR) and one or more costimulatory receptors. The characterization of signaling pathways induced by TCR and/or costimulatory receptor activation is critical, since these pathways are excellent targets for novel therapies for human disease. Although studies using human T cell lines have provided substantial insight into these signaling pathways, no comprehensive, direct comparison of these cell lines to activated peripheral blood T cells (APBTs) has been performed to validate their usefulness as a model of primary T cells.

Methodology/principal findings: We used quantitative biochemical techniques to compare the activation of two widely used human T cell lines, Jurkat E6.1 and HuT78 T cells, to APBTs. We found that HuT78 cells were similar to APBTs in proximal TCR-mediated signaling events. In contrast, Jurkat E6.1 cells had significantly increased site-specific phosphorylation of Pyk2, PLCgamma1, Vav1, and Erk1/Erk2 and substantially more Ca2+ flux compared to HuT78 cells and APBTs. In part, these effects appear to be due to an overexpression of Itk in Jurkat E6.1 cells compared to HuT78 cells and APBTs. Both cell lines differ from APBTs in the expression and function of costimulatory receptors and in the range of cytokines and chemokines released upon TCR and costimulatory receptor activation.

Conclusions/significance: Both Jurkat E6.1 and HuT78 T cells had distinct similarities and differences compared to APBTs. Both cell lines have advantages and disadvantages, which must be taken into account when choosing them as a model T cell line.


Conflict of interest statement

Competing Interests: The authors have declared that no competing interests exist.

Figures

Figure 1
Figure 1. Current model of proximal signaling pathways downstream of TCR activation.
TCR activation leads to the induction of numerous tyrosine kinases and adaptor proteins. The activation of these signaling molecules leads to morphological changes and alterations in transcription that are vital for T cell activation and function. Proteins that are tyrosine phosphorylated upon TCR stimulation are identified with small black circles.
Figure 2
Figure 2. HuT78 T cells have less TCR surface expression than Jurkat E6.1 T cells and APBTs.
The surface expression of the TCR α/β chain on Jurkat E6.1 T cells, HuT78 T cells, and APBTs was assessed by flow cytometry. A representative plot of the TCR surface expression of these cell lines is shown. The isotype control for each cell had a mean fluorescent intensity of <8. The experiment was repeated three times.
Figure 3
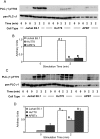
Figure 3. Jurkat E6.1 T cells exhibit decreased ZAP-70 Y319 phosphorylation compared to HuT78 T cells and APBTs.
(A) Three samples of Jurkat E6.1 T cells, HuT78 T cells, and APBTs were stimulated and the cellular proteins were separated by SDS-PAGE. The site-specific phosphorylation and expression of ZAP-70 was assessed by immunoblotting using ZAP-70 pY319 (top) and pan-ZAP-70 (bottom) antibodies. (B) The immunoblots were analyzed by densitometry and the ratio of the intensity of the phosphospecific ZAP-70 band to the pan-ZAP-70 band for each cell line was averaged. Letters represents significant differences of p<0.05.
Figure 4
Figure 4. Jurkat E6.1 T cells, HuT78 T cells, and APBTs have similar levels of LAT and SLP-76 phosphorylation.
(A) Three samples of Jurkat E6.1 T cells, HuT78 T cells, and APBTs were stimulated and the cellular proteins were separated by SDS-PAGE. The site-specific phosphorylation and expression of LAT was assessed by immunoblotting using LAT pY191 (top) and pan-LAT (bottom) antibodies. (B) The immunoblots were analyzed by densitometry and the ratio of the intensity of the phosphospecific LAT band to the pan-LAT band for each cell line was averaged. Letters represents significant differences of p<0.01. (C) Three samples of Jurkat E6.1 T cells, HuT78 T cells, and APBTs were stimulated and the cellular proteins were separated by SDS-PAGE. The site-specific phosphorylation and expression of SLP-76 was assessed by immunoblotting using SLP-76 pY128 (top) and pan-SLP-76 (bottom) antibodies. (D) The immunoblots were analyzed by densitometry and the ratio of the intensity of the phosphospecific SLP-76 band to the pan-SLP-76 band for each cell line was averaged. There were no significant differences between cell lines and p>0.25.
Figure 5
Figure 5. T cell lines have differences in PLCγ1 phosphorylation.
(A) Three samples of Jurkat E6.1 T cells, HuT78 T cells, and APBTs were stimulated and the cellular proteins were separated by SDS-PAGE. The site-specific phosphorylation and expression of PLCγ1 was assessed by immunoblotting using PLCγ1 pY783 (top) and pan-PLCγ1 (bottom) antibodies. (B) The immunoblots were analyzed by densitometry and the ratio of the intensity of the phosphospecific PLC-γ1 band to the pan-PLC-γ1 band for each cell line was averaged. Letters represents significant differences of p<0.0005. (C) Three samples of Jurkat E6.1 T cells, HuT78 T cells, and APBTs were stimulated and the cellular proteins were separated by SDS-PAGE. The site-specific phosphorylation and expression of PLCγ1 was assessed by immunoblotting using PLCγ1 pY775 (top) and pan-PLCγ1 (bottom) antibodies. (D) The immunoblots were analyzed by densitometry and the ratio of the intensity of the phosphospecific PLC-γ1 band to the pan-PLC-γ1 band for each cell line was averaged. Letters represents significant differences of p<0.03.
Figure 6
Figure 6. Jurkat E6.1 T cells have increased PLCγ1 function compared to HuT78 T cells and APBTs.
(A) Jurkat E6.1 T cells and HuT78 T cells were stimulated over a 30′ time course and the cellular proteins were separated by SDS-PAGE. The site-specific phosphorylation and expression of PLCγ1 and the expression of actin was assessed by immunoblotting using PLCγ1 pY783 (top) and pan-PLCγ1 (bottom) antibodies. (B) TCR-induced calcium flux was measured quantitatively as described above. Traces for Jurkat E6.1 T cells, HuT78 T cells and APBTs are shown.
Figure 7
Figure 7. Jurkat E6.1 T cells, HuT78 T cells, and APBTs have different levels of Pyk2 Y580 phosphorylation.
(A) Three samples of Jurkat E6.1 T cells, HuT78 T cells, and APBTs were stimulated and the cellular proteins were separated by SDS-PAGE. The site-specific phosphorylation and expression of Pyk2 was assessed by immunoblotting using Pyk2 pY580 (top) and pan-Pyk2 (bottom) antibodies. (B) The immunoblots were analyzed by densitometry and the ratio of the intensity of the phosphospecific Pyk2 band to the pan-Pyk2 band for each cell line was averaged. Letters represents significant differences of p<0.05. (C) PTP-PEST was immunoprecipitated for Jurkat E6.1 T cells, HuT78 T cells and APBTs. The expression of PTP-PEST in the different T cells was assessed by immunoblotting.
Figure 8
Figure 8. Jurkat E6.1 T cells exhibit hyperphosphorylated of Vav1 Y174 compared to HuT78 T cells and APBTs.
(A) Three samples of Jurkat E6.1 T cells, HuT78 T cells, and APBTs were stimulated and the cellular proteins were separated by SDS-PAGE. The site-specific phosphorylation and expression of Vav1 was assessed by immunoblotting using Vav1 pY174 (top) and pan-Vav1 (bottom) antibodies. (B) The immunoblots were analyzed by densitometry and the ratio of the intensity of the phosphospecific Vav1 band to the pan-Vav1 band for each cell line was averaged. Letters represents significant differences of p<0.005.
Figure 9
Figure 9. Jurkat E6.1 T cells have increased expression and TCR-induced phosphorylation of Itk compared to HuT78 T cells and APBTs.
(A) Itk was immunoprecipitated from lysates for TCR-induced Jurkat E6.1 T cells, HuT78 T cells, and APBTs and the cellular proteins were separated by SDS-PAGE. The site-specific phosphorylation and expression of Itk was assessed by immunoblotting using Itk pY511 (top) and pan-Itk (bottom) antibodies. (B) The immunoblots were analyzed by densitometry and the ratio of the intensity of the phosphospecific Itk band to the pan-Itk band for each cell line for three separate experiments was averaged. Letters represents significant differences of p<0.04. (C) Whole cell lysates of Jurkat E6.1 T cells and HuT78 T cells were prepared and immunoblotted using pan-Itk (top) and actin (bottom) antibodies.
Figure 10
Figure 10. Jurkat E6.1 T cells have hyperphosphorylated Erk1/Erk2 compared to HuT78 T cells and APBTs.
(A) Three samples of Jurkat E6.1 T cells, HuT78 T cells, and APBTs were stimulated and the cellular proteins were separated by SDS-PAGE. The site-specific phosphorylation and expression of Erk1 and Erk2 was assessed by immunoblotting using Erk1/Erk2 pT202/pY204 (top) and pan-Erk1/Erk2 (bottom) antibodies. (B) The immunoblots were analyzed by densitometry and the ratio of the intensity of the phosphospecific Erk1/Erk2 bands to the pan-Erk1/Erk2 bands for each cell line for three separate experiments was averaged. Letters represents significant differences of p<0.005.
Figure 11
Figure 11. Jurkat E6.1 T cells and HuT78 T cells have aberrant IL-2 production compared to APBTs.
Jurkat E6.1 T cells, HuT78 T cells and APBTs were stimulated using a CD3 antibody (1 µg/mL), both alone and in combination with a stimulatory CD28 antibody (2 µg/mL) and fibronectin (1 µg/mL). The production of IL-2 after 24 hours of stimulation was assessed by ELISA as described above.

References

    1. Nel AE. T-cell activation through the antigen receptor. Part 1: signaling components, signaling pathways, and signal integration at the T-cell antigen receptor synapse. J Allergy Clin Immunol. 2002;109:758–770. - PubMed
    1. Sundberg EJ, Deng L, Mariuzza RA. TCR recognition of peptide/MHC class II complexes and superantigens. Semin Immunol. 2007;19:262–271. - PMC - PubMed
    1. Hansson GK. Inflammation, atherosclerosis, and coronary artery disease. N Engl J Med. 2005;352:1685–1695. - PubMed
    1. Lechler RI, Sykes M, Thomson AW, Turka LA. Organ transplantation–how much of the promise has been realized? Nat Med. 2005;11:605–613. - PubMed
    1. Monaco C, Andreakos E, Kiriakidis S, Feldmann M, Paleolog E. T-cell-mediated signalling in immune, inflammatory and angiogenic processes: the cascade of events leading to inflammatory diseases. Curr Drug Targets Inflamm Allergy. 2004;3:35–42. - PubMed

Publication types