

New approaches to studying problem behaviors: a comparison of methods for modeling longitudinal, categorical adolescent drinking data
- PMID: 19413423
- PMCID: PMC2791967
- DOI: 10.1037/a0014851
New approaches to studying problem behaviors: a comparison of methods for modeling longitudinal, categorical adolescent drinking data
Abstract
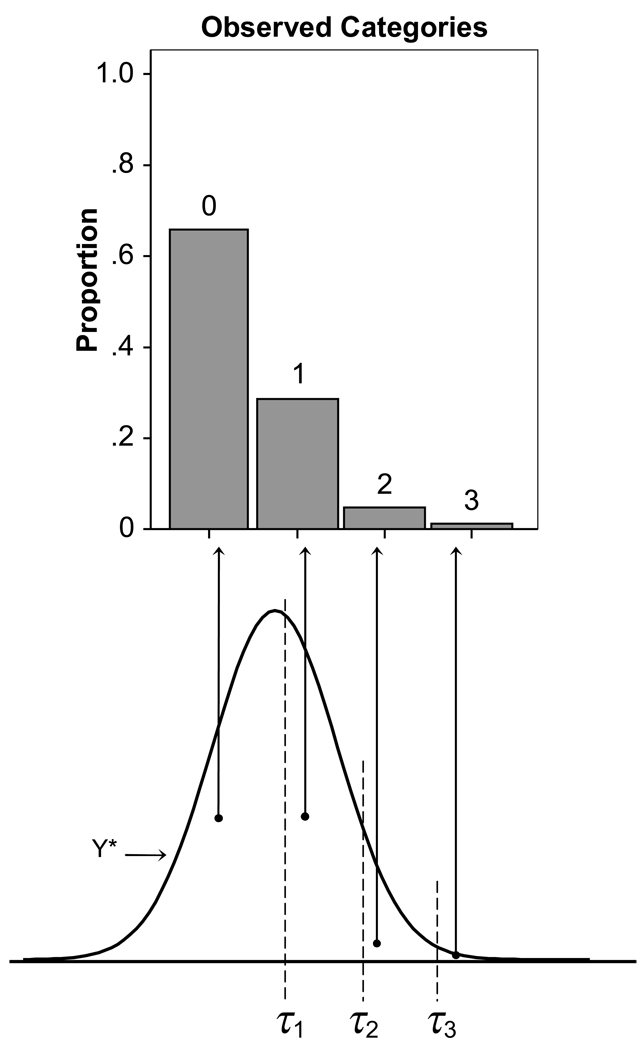
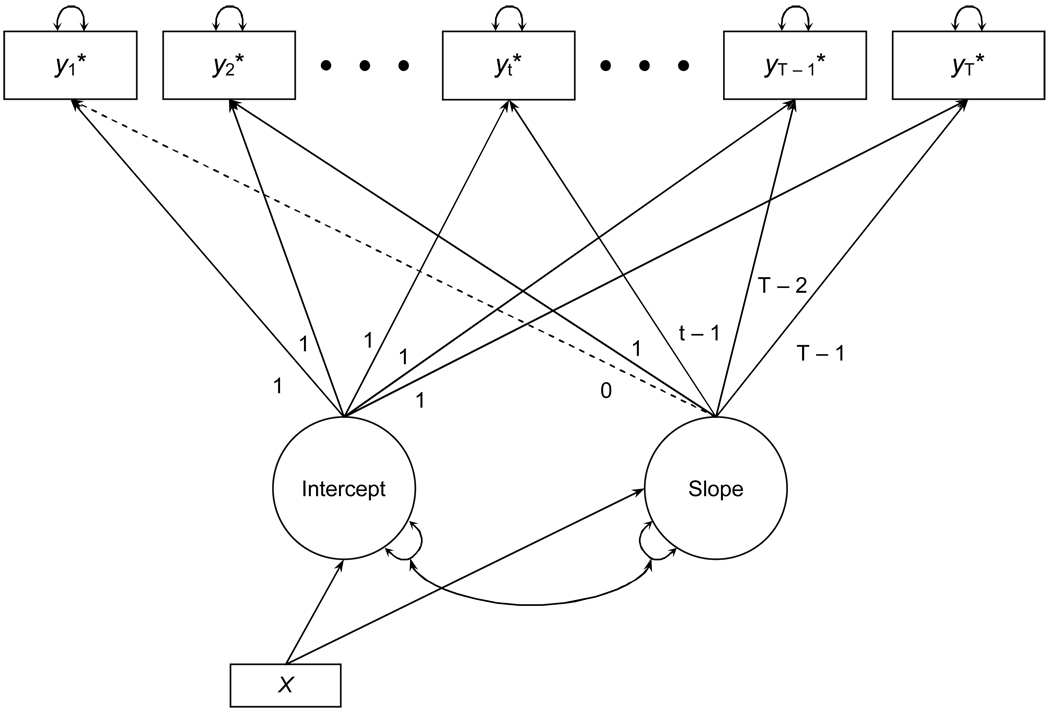
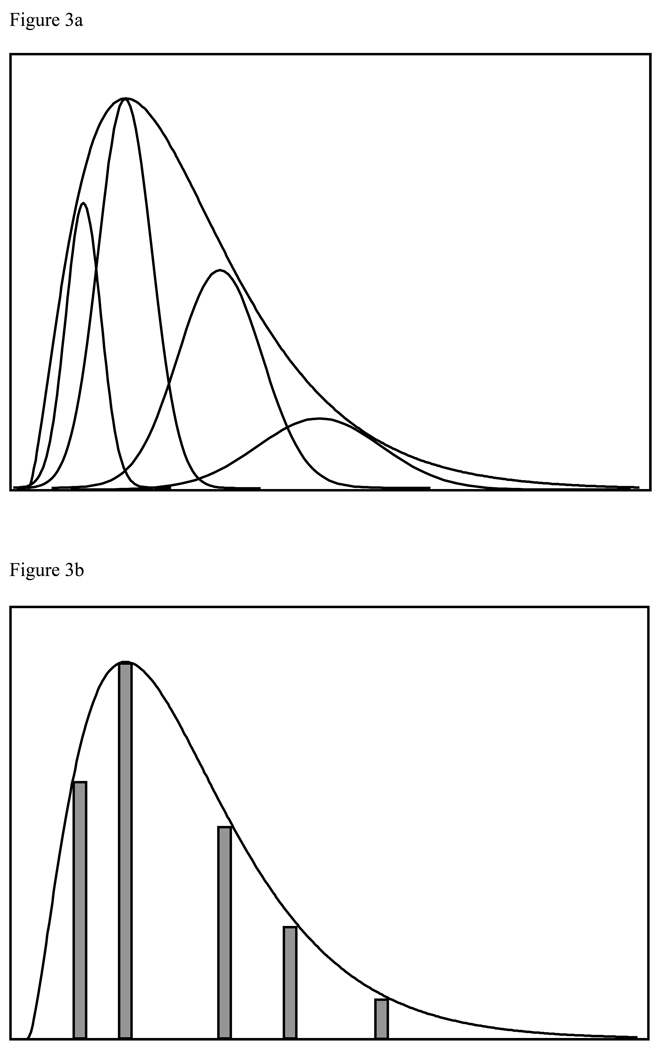
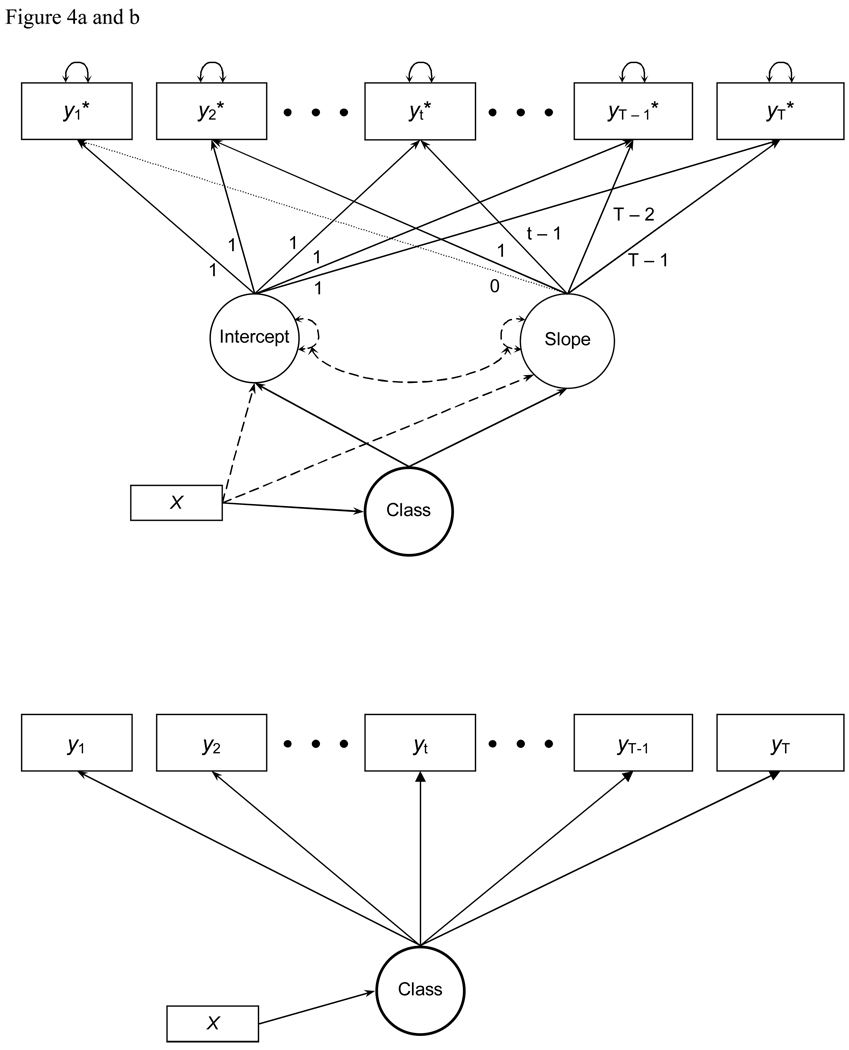
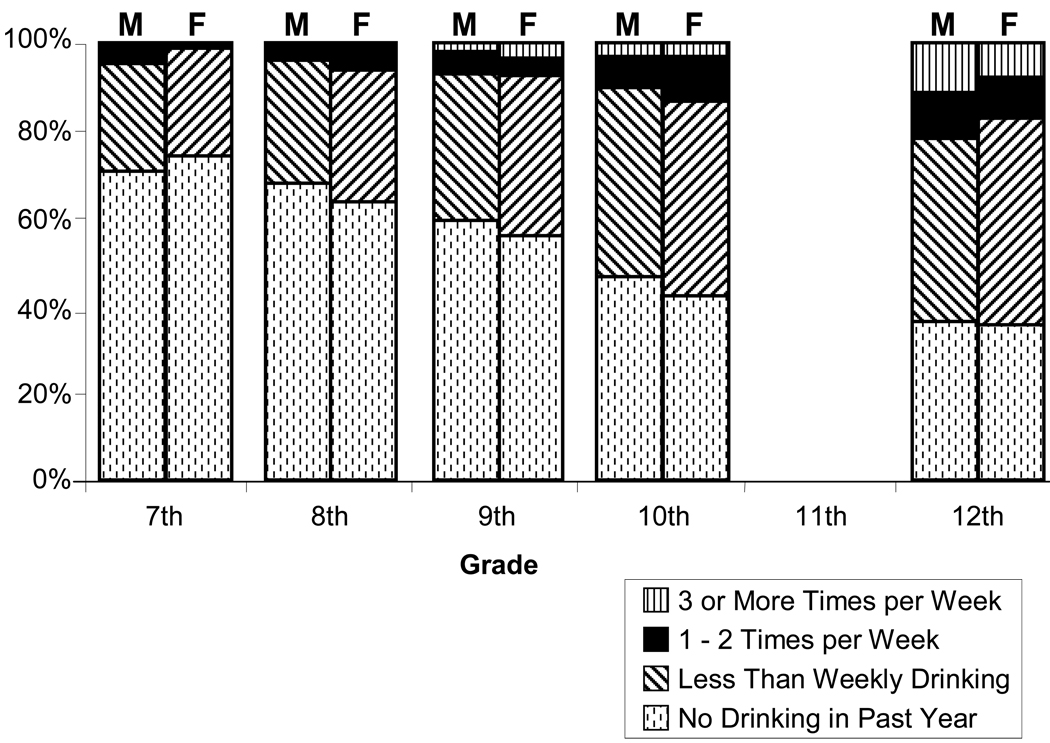
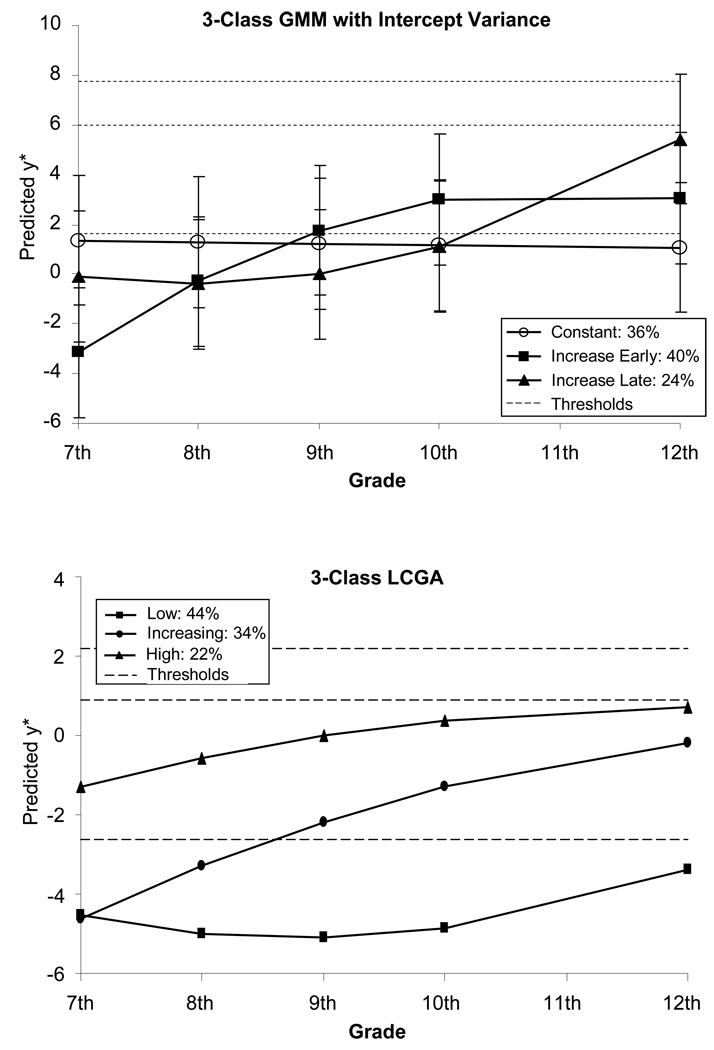
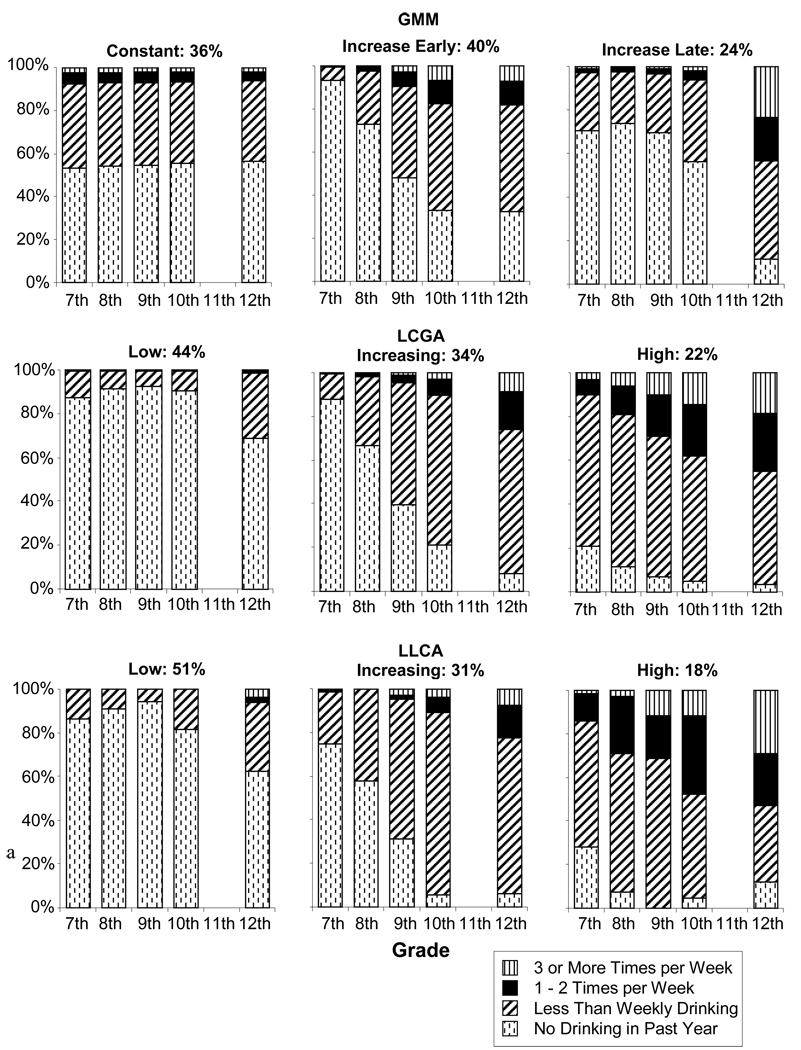
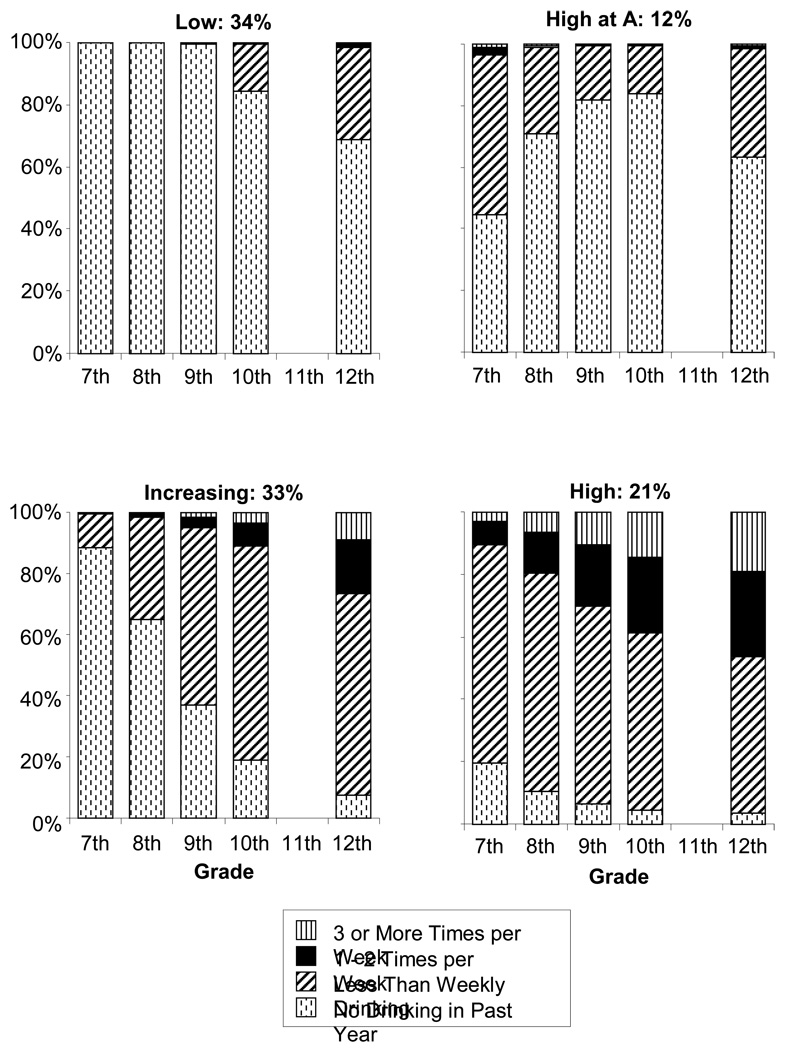
Analyzing problem-behavior trajectories can be difficult. The data are generally categorical and often quite skewed, violating distributional assumptions of standard normal-theory statistical models. In this article, the authors present several currently available modeling options, all of which make appropriate distributional assumptions for the observed categorical data. Three are based on the generalized linear model: a hierarchical generalized linear model, a growth mixture model, and a latent class growth analysis. They also describe a longitudinal latent class analysis, which requires fewer assumptions than the first 3. Finally, they illustrate all of the models using actual longitudinal adolescent alcohol-use data. They guide the reader through the model-selection process, comparing the results in terms of convergence properties, fit and residuals, parsimony, and interpretability. Advances in computing and statistical software have made the tools for these types of analyses readily accessible to most researchers. Using appropriate models for categorical data will lead to more accurate and reliable results, and their application in real data settings could contribute to substantive advancements in the field of development and the science of prevention.
Copyright 2009 APA, all rights reserved
Figures
Similar articles
-
Modeling change trajectories with count and zero-inflated outcomes: Challenges and recommendations.Addict Behav. 2019 Jul;94:4-15. doi: 10.1016/j.addbeh.2018.09.016. Epub 2018 Sep 10. Addict Behav. 2019. PMID: 30322730
-
A comparison of longitudinal modelling approaches: Alcohol and cannabis use from adolescence to young adulthood.Drug Alcohol Depend. 2019 Aug 1;201:58-64. doi: 10.1016/j.drugalcdep.2019.05.001. Epub 2019 May 29. Drug Alcohol Depend. 2019. PMID: 31195345
-
Inference in regression models of heavily skewed alcohol use data: a comparison of ordinary least squares, generalized linear models, and bootstrap resampling.Psychol Addict Behav. 2007 Dec;21(4):441-452. doi: 10.1037/0893-164X.21.4.441. Psychol Addict Behav. 2007. PMID: 18072826
-
Folic acid supplementation and malaria susceptibility and severity among people taking antifolate antimalarial drugs in endemic areas.Cochrane Database Syst Rev. 2022 Feb 1;2(2022):CD014217. doi: 10.1002/14651858.CD014217. Cochrane Database Syst Rev. 2022. PMID: 36321557 Free PMC article.
-
Multivariable prognostic models: issues in developing models, evaluating assumptions and adequacy, and measuring and reducing errors.Stat Med. 1996 Feb 28;15(4):361-87. doi: 10.1002/(SICI)1097-0258(19960229)15:4<361::AID-SIM168>3.0.CO;2-4. Stat Med. 1996. PMID: 8668867 Review.
Cited by
-
Growth, Persistence, and Desistance of Alcohol Use for At-Risk Men in Their 30s.Alcohol Clin Exp Res. 2015 Jul;39(7):1203-11. doi: 10.1111/acer.12748. Epub 2015 May 22. Alcohol Clin Exp Res. 2015. PMID: 26010338 Free PMC article.
-
Alcohol, Marijuana and Other Illicit Drugs Use Throughout Adolescence: Co-occurring Courses and Preadolescent Risk-Factors.Child Psychiatry Hum Dev. 2022 Dec;53(6):1194-1206. doi: 10.1007/s10578-021-01202-w. Epub 2021 Jun 10. Child Psychiatry Hum Dev. 2022. PMID: 34110528
-
More than just fun and games: the longitudinal relationships between strategic video games, self-reported problem solving skills, and academic grades.J Youth Adolesc. 2013 Jul;42(7):1041-52. doi: 10.1007/s10964-013-9913-9. Epub 2013 Jan 24. J Youth Adolesc. 2013. PMID: 23344653
-
Trajectories of depression symptoms in a therapist-supported digital mental health intervention: a repeated measures latent profile analysis.Soc Psychiatry Psychiatr Epidemiol. 2023 Aug;58(8):1237-1246. doi: 10.1007/s00127-022-02402-y. Epub 2023 Jan 18. Soc Psychiatry Psychiatr Epidemiol. 2023. PMID: 36651947 Free PMC article.
-
Patterns and Disparities in Human Papillomavirus (HPV) Vaccine Uptake for Young Female Adolescents among U.S. States: NIS-Teen (2008-2016).Cancer Epidemiol Biomarkers Prev. 2020 Jul;29(7):1458-1467. doi: 10.1158/1055-9965.EPI-19-1103. Epub 2020 Apr 28. Cancer Epidemiol Biomarkers Prev. 2020. PMID: 32345710 Free PMC article.
References
-
- Agresti A. Categorical data analysis. 2nd ed. Hoboken, NJ: Wiley; 2002.
-
- Agresti A, Booth JG, Hobert JP, Caffo B. Random-effects modeling of categorical response data. Sociological Methodology. 2000;30:27–80.
-
- Ashford JR. An approach to the analysis of data for semi-quantal responses in biological assay. [Article] Biometrics. 1959;15(4):573–581.
-
- Bauer DJ. A semiparametric approach to modeling nonlinear relations among latent variables. Structural Equation Modeling. 2005;12:513–535.
-
- Bauer DJ, Curran PJ. Distributional assumptions of growth mixture models: Implications for overextraction of latent trajectory classes. Psychological Methods. 2003;8:338–363. - PubMed
Publication types
MeSH terms
Grants and funding
- R01 HD051746/HD/NICHD NIH HHS/United States
- HD047573/HD/NICHD NIH HHS/United States
- HD027724/HD/NICHD NIH HHS/United States
- DA05347/DA/NIDA NIH HHS/United States
- R01 MH051361/MH/NIMH NIH HHS/United States
- MH51361/MH/NIMH NIH HHS/United States
- MH19734/MH/NIMH NIH HHS/United States
- R01 HD047573/HD/NICHD NIH HHS/United States
- MH48165/MH/NIMH NIH HHS/United States
- MH43270/MH/NIMH NIH HHS/United States
- T32 MH019734/MH/NIMH NIH HHS/United States
- K05 MH000567/MH/NIMH NIH HHS/United States
- MH00567/MH/NIMH NIH HHS/United States
