. 2009;183(1):117-132.
doi: 10.1111/j.1469-8137.2009.02843.x. Epub 2009 Apr 29.

A functional analysis of the pyrimidine catabolic pathway in Arabidopsis

Affiliations
Free PMC article

A functional analysis of the pyrimidine catabolic pathway in Arabidopsis

Rita Zrenner et al. New Phytol. 2009.
Free PMC article

Abstract

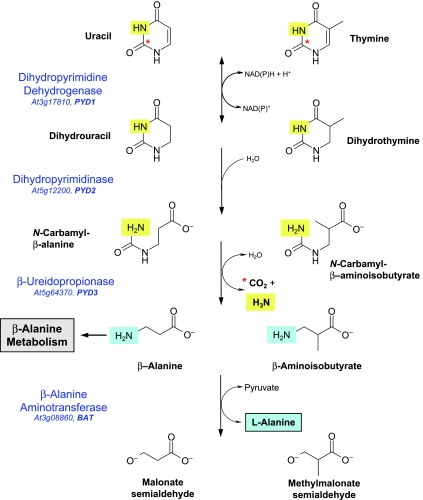
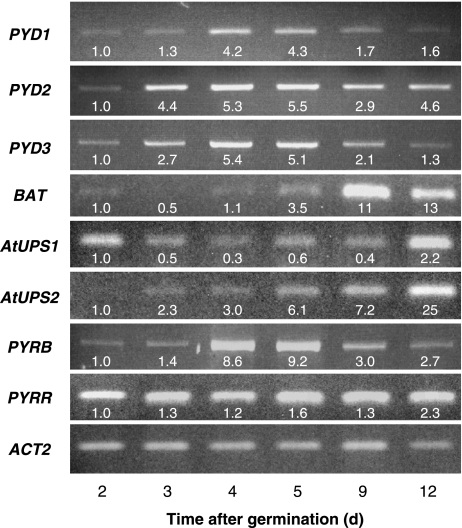
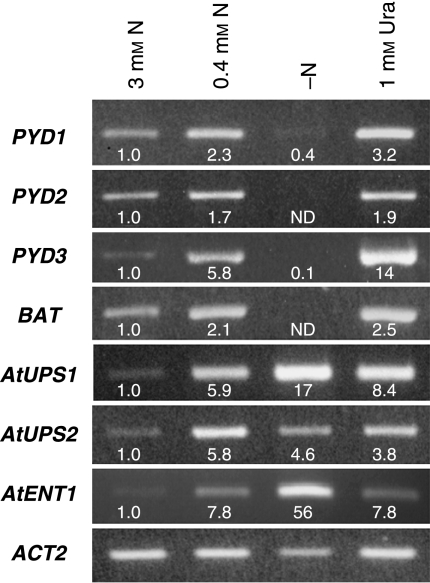
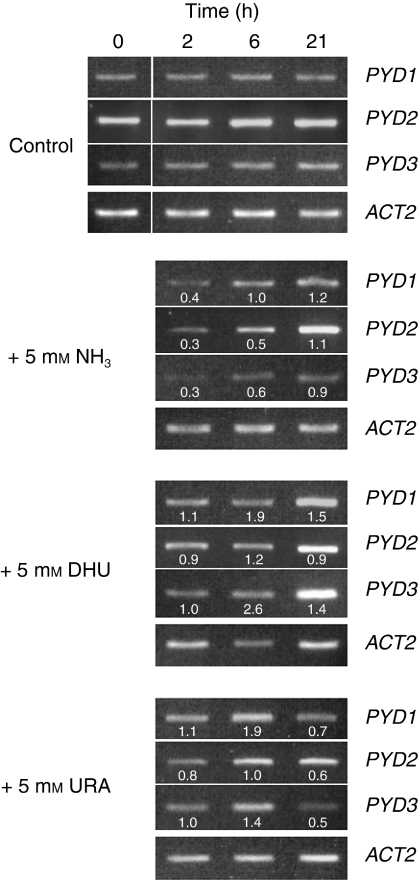
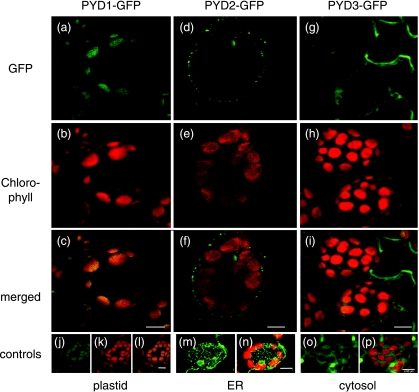
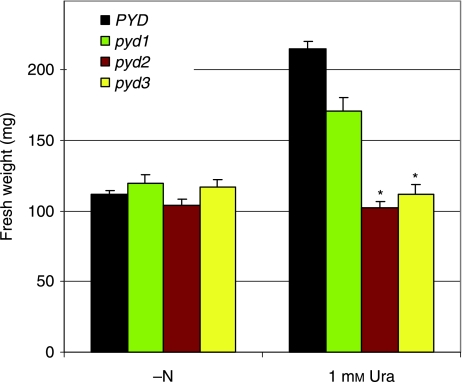
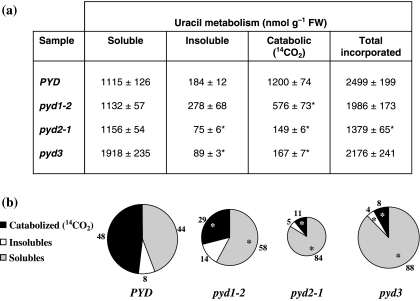
* Reductive catabolism of pyrimidine nucleotides occurs via a three-step pathway in which uracil is degraded to beta-alanine, CO(2) and NH(3) through sequential activities of dihydropyrimidine dehydrogenase (EC 1.3.1.2, PYD1), dihydropyrimidinase (EC 3.5.2.2, PYD2) and beta-ureidopropionase (EC 3.5.1.6, PYD3). * A proposed function of this pathway, in addition to the maintenance of pyrimidine homeostasis, is the recycling of pyrimidine nitrogen to general nitrogen metabolism. PYD expression and catabolism of [2-(14)C]-uracil are markedly elevated in response to nitrogen limitation in plants, which can utilize uracil as a nitrogen source. * PYD1, PYD2 and PYD3 knockout mutants were used for functional analysis of this pathway in Arabidopsis. pyd mutants exhibited no obvious phenotype under optimal growing conditions. pyd2 and pyd3 mutants were unable to catabolize [2-(14)C]-uracil or to grow on uracil as the sole nitrogen source. By contrast, catabolism of uracil was reduced by only 40% in pyd1 mutants, and pyd1 seedlings grew nearly as well as wild-type seedlings with a uracil nitrogen source. These results confirm PYD1 function and suggest the possible existence of another, as yet unknown, activity for uracil degradation to dihydrouracil in this plant. * The localization of PYD-green fluorescent protein fusions in the plastid (PYD1), secretory system (PYD2) and cytosol (PYD3) suggests potentially complex metabolic regulation.


Figures

Fig. 1
Fig. 1
The reductive pathway for the degradation of pyrimidine nucleotides in Arabidopsis. Names of enzymes catalysing each reaction are given with the AGI locus and gene name. The asterisk indicates C-2 of the pyrimidine ring, which is released as CO2 in the PYD3 reaction. The N-3 pyrimidine nitrogen (light highlighting) is also released as ammonia at this step. The fourth step, in which the putative β-alanine aminotransferase (BAT) transfers pyrimidine N-1 (darker highlighting) to pyruvate or 2-oxoglutarate to form l-alanine or l-glutamate, respectively, is not considered to be part of the reductive pathway. It is included here to illustrate the route by which both pyrimidine nitrogen atoms are assimilated into general nitrogen metabolism.
Fig. 2
Fig. 2
Reverse transcriptase-polymerase chain reaction (RT-PCR) expression profiles for genes encoding catabolic pathway enzymes (PYD1–3, BAT), nucleobase transporters with high affinity for uracil (AtUPS1, AtUPS2), the de novo synthesis pathway enzyme aspartate transcarbamoylase (PYRB) and salvage enzyme uracil phosphoribosyltransferase (PYRR). Expression values for each transcript, relative to Day 2 and normalized on the basis of constitutively expressed ACT2, are indicated below each band. Arabidopsis seedlings were grown in liquid culture and harvested at the indicated number of days after germination.
Fig. 3
Fig. 3
Reverse transcriptase-polymerase chain reaction (RT-PCR) analysis of gene expression in rosette leaf tissue of 6-wk-old Arabidopsis seedlings grown in vermiculite potting medium and fertilized with 1/2 × Murashige and Skoog (MS) medium containing 3 mm nitrogen, 0.4 mm nitrogen, no nitrogen (−N) or 1 mm uracil (Ura) as sole nitrogen source. PYD1–3, catabolic pathway; BAT, β-alanine aminotransferase; AtUPS1 and AtUPS2, uracil transporters; AtENT1, uridine transporter; ACT2, constitutively expressed reference gene. Expression values for each transcript, relative to seedlings grown in 3 mm nitrogen and normalized on the basis of ACT2expression, are indicated below each band. ND, not detectable.
Fig. 4
Fig. 4
Reverse transcriptase-polymerase chain reaction (RT-PCR) expression profiles for PYD1–3 in 17-d-old liquid-cultured Arabidopsis seedlings grown in 1/2 × Murashige and Skoog (MS) medium, with a fresh medium change at Day 9. Time = 0 h is 4 h after the beginning of the light period, when cultures received either no supplements (control) or NH3, dihydrouracil (DHU) or uracil (Ura) at 5 mm final concentration. Expression values for each transcript at 2, 6 or 21 h after supplement addition are relative to those in control plants, normalized on the basis of ACT2expression, and are indicated below each band.
Fig. 5
Fig. 5
Localization of PYD1-GFP, PYD2-GFP and PYD3-GFP in mesophyll cells of stably transformed Arabidopsis. (a) PYD1-GFP, GFP fluorescence signal (green); (b) PYD1-GFP, chlorophyll autofluorescence signal (red); (c) PYD1-GFP, overlay of GFP and chlorophyll fluorescence signals; (d) PYD2-GFP, GFP fluorescence signal; (e) PYD2-GFP, chlorophyll autofluorescence signal; (f) PYD2-GFP, overlay of GFP and chlorophyll fluorescence signals; (g) PYD3-GFP, GFP fluorescence signal; (h) PYD3-GFP, chlorophyll autofluorescence signal; (i) PYD3-GFP, overlay of GFP and chlorophyll fluorescence signals. (j–l) AMK2-GFP, plastid control: GFP fluorescence signal (green), chlorophyll autofluorescence signal (red) and overlay (Lange et al., 2008); (m, n) mgfp4-ER, endoplasmic reticulum (ER) control: GFP fluorescence signal (green) and overlay with chlorophyll autofluorescence signal (red) (Haseloff 1998); (o, p) GFP only, cytosolic control: GFP fluorescence signal (green) and overlay with chlorophyll autofluorescence signal (red); Bar, 8 µm.
Fig. 6
Fig. 6
Relative transcript levels of pyrimidine nucleotide metabolism genes in pyd mutants. Arabidopsis seedlings (16-d-old) grown on plates containing half-strength Murashige and Skoog (MS) medium with 0.5% sucrose were analysed by quantitative real-time reverse transcriptase-polymerase chain reaction (RT-PCR). Values are calculated as the difference of the Ct value from EF1α taken to the power of efficiency. Each bar represents the expression of the gene in question in the respective mutant relative to the expression in the wild-type. Each bar represents the mean values of six individual seedlings. Measurements were repeated twice. Significant differences (P < 0.05) using unpaired two-tailed t-tests are marked with an asterisk. CARA, carbamoylphosphate synthase, small subunit EC 6.3.5.5; CARB, carbamoylphosphate synthase, large subunit EC 6.3.5.5; NDK, nucleoside diphosphate kinase EC 2.7.4.6; PYRB, aspartate transcarbamoylase EC 2.1.3.2; PYRC, dihydroorotase EC 3.5.2.3; PYRD, dihydroorotate dehydrogenase EC 1.3.99.11; PYRFF, UMP synthase EC 2.4.2.10 and EC 4.1.1.23; PYRR, uracil phosphoribosyl transferase EC 2.4.2.9; UK, uridine kinase EC 2.7.1.48; UMK, uridine monophosphate kinase EC 2.7.4.4; UPRT, uracil phosphoribosyl transferase-like EC 2.4.2.9; URH, uridine nucleosidase EC 3.2.2.3.
Fig. 8
Fig. 8
Growth of wild-type PYD and pyd mutant Arabidopsis plants in sterile culture on media containing either no nitrogen (−N), or 1 mm uracil (1 mm Ura). Complete rosettes were harvested after 38 d of growth and the fresh weight was recorded. Values represent the means ± standard error of at least 22 individual seedlings. Significant differences compared with PYD in each group (P < 0.05) using unpaired two-tailed t-tests are marked with an asterisk.
Fig. 7
Fig. 7
[2-14C]-Uracil (Ura) metabolism by Arabidopsis seedlings. (a) Total incorporated label and distribution within catabolic (14CO2), perchloric acid (PCA)-soluble (nucleobases, nucleosides, nucleotides, nucleoside diphosphate sugars) and PCA-insoluble (DNA and RNA) pools. Data are expressed on a nmol Ura g−1 fresh weight basis and represent the means ± standard error of three biological replicates. Unpaired two-tailed t-tests were used to compare labelling data for wild-type PYD and pyd mutant plants. Significant differences with P < 0.05 are labelled with an asterisk. (b) Metabolite labelling as a percentage of total incorporated Ura. The size of the circle represents the amount of Ura that was taken up by the respective seedling culture.

References

    1. Abramoff MD, Magelhaes PJ, Ram SJ. Image processing with ImageJ. Biophotonics International. 2004;11:36–42.
    1. Alonso JM, Stepanova AN, Leisse TJ, Kim CJ, Chen H, Shinn P, Stevenson DK, Zimmerman J, Barajas P, Cheuk R, et al. Genome-wide insertional mutagenesis of Arabidopsis thaliana. Science. 2003;301:653–657. - PubMed
    1. Andersen B, Lundgren S, Dobritzsch D, Piškur J. A recruited protease is involved in catabolism of pyrimidines. Journal of Molecular Biology. 2008a;379:243–250. - PubMed
    1. Andersen G, Björnberg O, Polakova S, Pynyaha Y, Rasmussen A, Møller K, Hofer A, Moritz T, Sandrini MPB, Merico A-M, et al. A second pathway to degrade pyrimidine nucleic acid precursors in eukaryotes. Journal of Molecular Biology. 2008b;380:656–666. - PubMed
    1. Ashihara H. Pattern of uracil metabolism during ageing of tobacco leaves. Acta Physiologiae Plantarum. 1981;3:77–84.

Publication types

MeSH terms