

doi: 10.1016/j.bpj.2009.01.045.
Stiffening effect of cholesterol on disordered lipid phases: a combined neutron spin echo + dynamic light scattering analysis of the bending elasticity of large unilamellar vesicles
Affiliations
- PMID: 19413968
- PMCID: PMC2711415
- DOI: 10.1016/j.bpj.2009.01.045
Item in Clipboard
Stiffening effect of cholesterol on disordered lipid phases: a combined neutron spin echo + dynamic light scattering analysis of the bending elasticity of large unilamellar vesicles
Biophys J.
.
Abstract
In this study, the center-of-mass diffusion and shape fluctuations of large unilamellar 1-palmitoyl-2-oleyl-sn-glycero-phosphatidylcholine vesicles prepared by extrusion are studied by means of neutron spin echo in combination with dynamic light scattering. The intermediate scattering functions were measured for several different values of the momentum transfer, q, and for different cholesterol contents in the membrane. The combined analysis of neutron spin echo and dynamic light scattering data allows calculation of the bending elastic constant, kappa, of the vesicle bilayer. A stiffening effect monitored as an increase of kappa with increasing cholesterol molar ratio is demonstrated by these measurements.
Figures
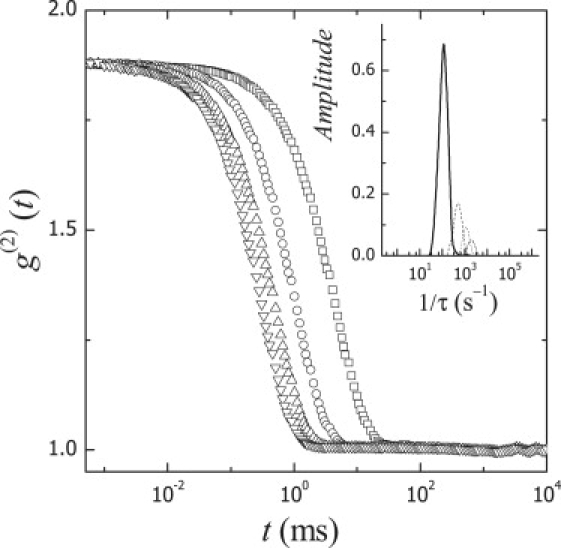
Experimental DLS intensity autocorrelation functions g(2)(t) for vesicles based on POPC + 20% cholesterol at different scattering wave vectors (q = 0.0081 nm−1 (○), 0.0157 nm−1 (□), 0.0222 nm−1 (△), and 0.0272 nm−1 (▽)). (Inset) Distributions of relaxation rates calculated by CONTIN.
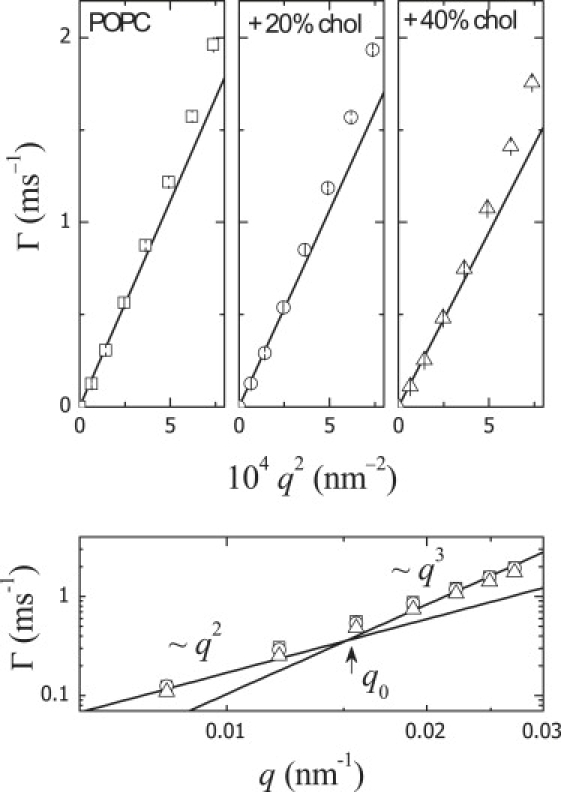
Typical plot of ΓT versus q2 of the translation relaxation frequencies obtained from CONTIN analysis of the DLS autocorrelation functions.
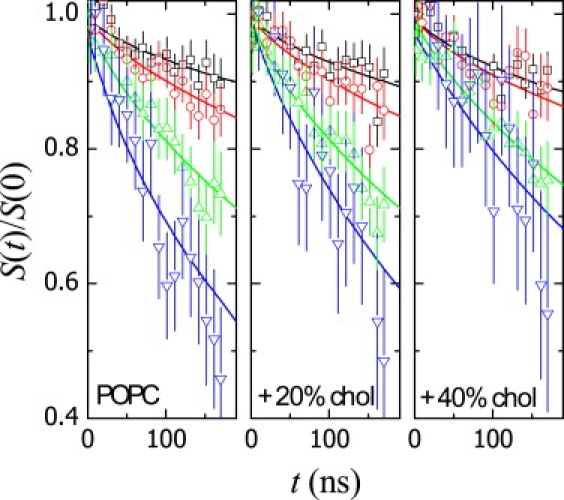
Intermediate NSE relaxation functions for vesicle dispersions at different cholesterol contents from experiments at different wave vectors (q = 0.12 nm−1 (□), 0.43 nm−1 (○), 0.70 nm−1 (△), and 0.97 nm−1 (▽)). The presence of increasing cholesterol leads to longer relaxation times and, hence, slower relaxation rates. The straight lines represent the best fits to Eq. 11 (see text for details).
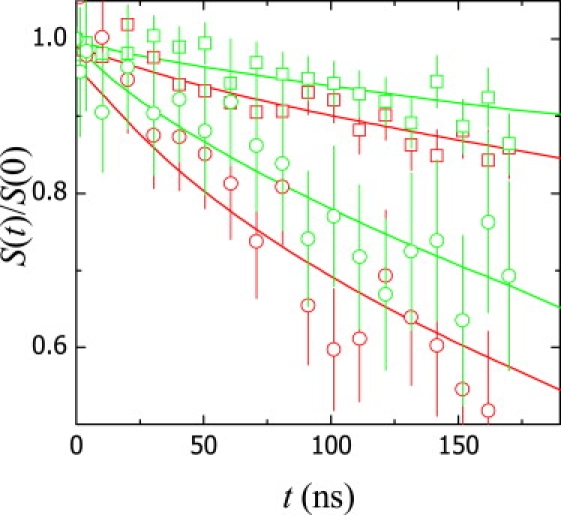
Influence of cholesterol on NSE intermediate scattering functions in pure POPC vesicles (red symbols) and POPC vesicles with 50 mol % added cholesterol (green symbols). For simplicity only two different wave vectors are plotted: q = 0.12 nm−1 (squares) and q = 0.97 nm−1 (circles). The presence of cholesterol leads to longer relaxation times and, hence, slower relaxation rates. The straight lines represent the best fits to Eq. 11.
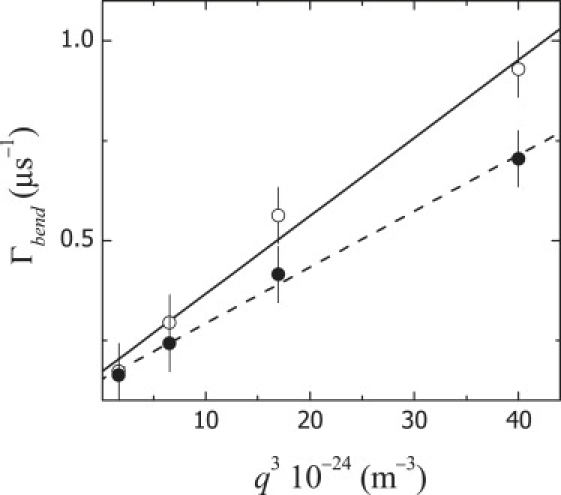
ZG plot of the relaxation rates of the fluctuation mode for POPC (○) and POPC + 50 mol % cholesterol (•). According to ZG theory, the Γ versus q3 plot should be linear and the bending rigidity, κ, can be calculated from the slope (see Eq. 4).
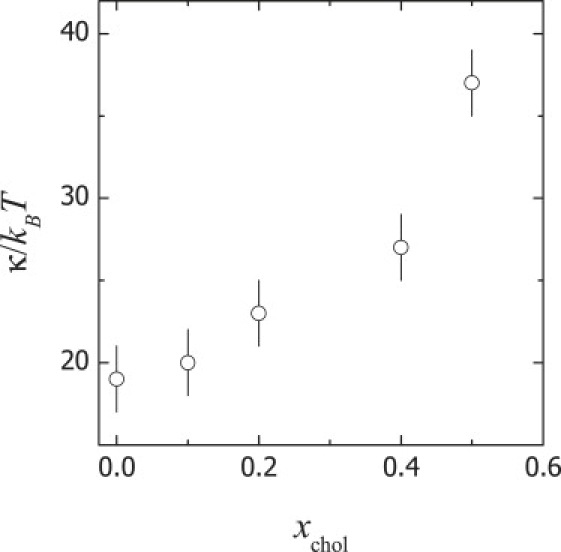
Bending rigidity, κ, of POPC vesicles at increasing cholesterol content. xchol, cholesterol molar fraction.
References
-
- Presti F.T. The role of cholesterol in membrane fluidity. In: Aloia R.C., Boggs J.M., editors. Membrane Fluidity in Biology, vol 4. Academic Press; New York: 1985. pp. 97–146.
-
- Finegold L.X. CRC Press; Boca Raton, FL: 1993. Cholesterol in Membrane Models.
-
- Mouritsen O.G., Jørgensen K. Dynamical order and disorder in lipid bilayers. Chem. Phys. Lipids. 1994;73:3–25. - PubMed
-
- Alberts B., Johnson A., Lewis J. 5th ed. Taylor & Francis; New York & London: 2008. Molecular Biology of the Cell.
-
- Jamieson G.A., Robinson D.M. Butterworths; London: 1977. Mammalian Cell Membranes vol 2.
Publication types
MeSH terms
Substances
LinkOut - more resources
Full Text Sources
Medical
