. 2009 Aug 15;47(4):381-8.
doi: 10.1016/j.freeradbiomed.2009.04.034. Epub 2009 May 3.

Enhanced ROS production and redox signaling with combined arsenite and UVA exposure: contribution of NADPH oxidase

Affiliations

Enhanced ROS production and redox signaling with combined arsenite and UVA exposure: contribution of NADPH oxidase

Karen L Cooper et al. Free Radic Biol Med. .

Abstract

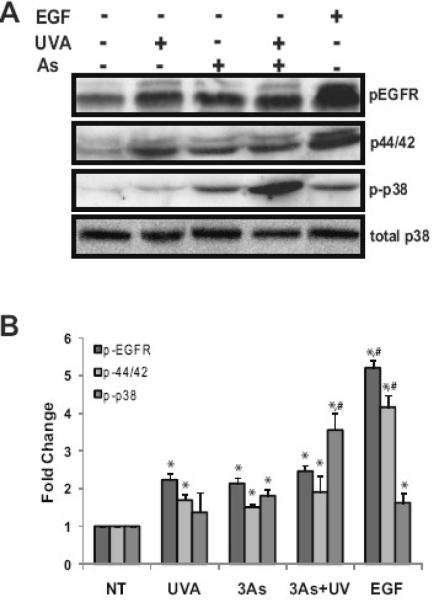
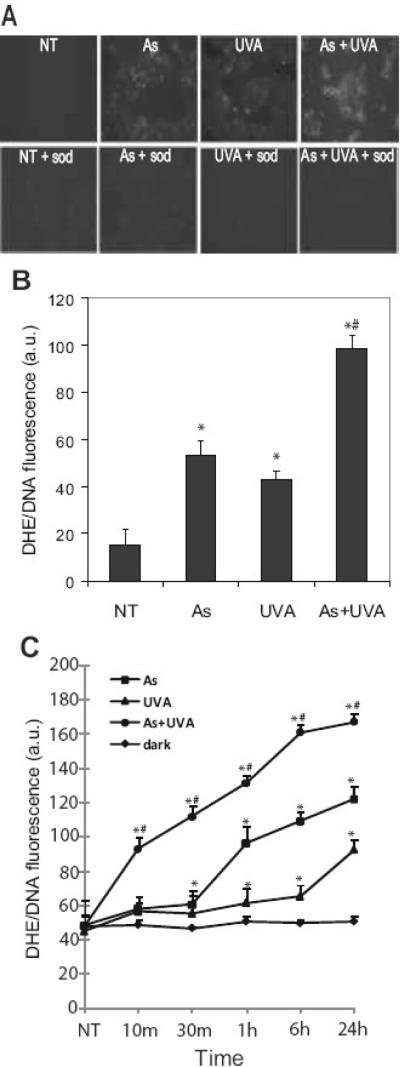
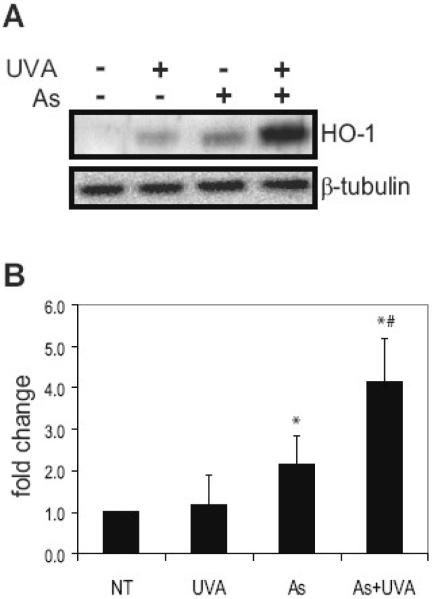
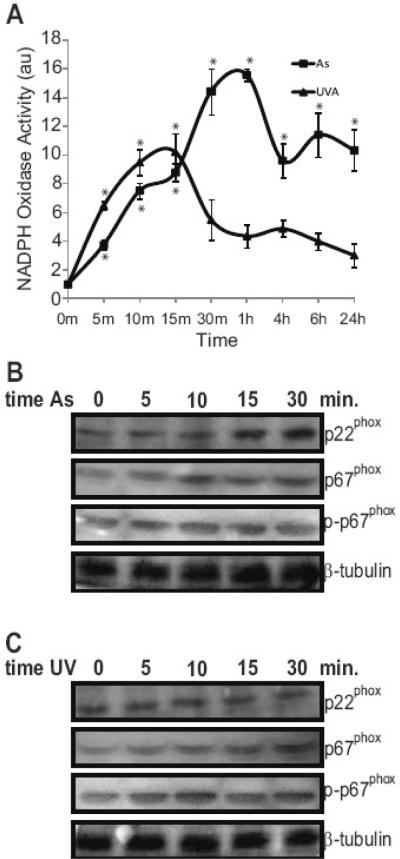
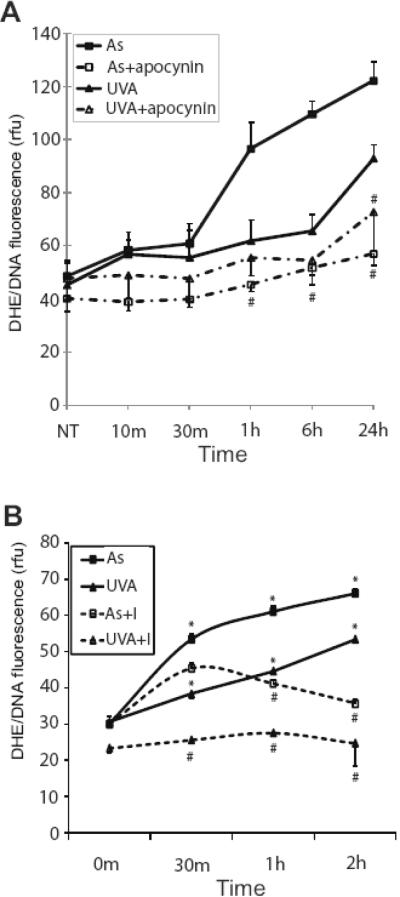
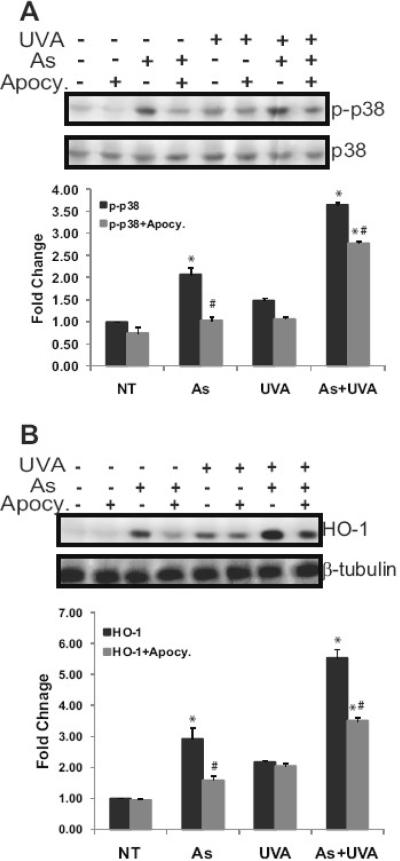
Solar ultraviolet radiation (UVR) is the major etiological factor in skin carcinogenesis. However, in vivo studies demonstrate that mice exposed to arsenic and UVR exhibit significantly more tumors and oxidative DNA damage than animals treated with either agent alone. Interactions between arsenite and UVR in the production of reactive oxygen species (ROS) and stress-associated signaling may provide a basis for the enhanced carcinogenicity. In this study keratinocytes were pretreated with arsenite (3 microM) and then exposed to UVA (10 kJ/m(2)). We report that exposure to UVA after arsenite pretreatment enhanced ROS production, p38 MAP kinase activation, and induction of a redox-sensitive gene product, heme oxygenase-1, compared to either stimulus alone. UVR exposure resulted in rapid and transient NADPH oxidase activation, whereas the response to arsenite was more pronounced and persistent. Inhibition of NADPH oxidase decreased ROS production in arsenite-treated cells but had little impact on UVA-exposed cells. Furthermore, arsenite-induced, but not UVA-induced, p38 activation and HO-1 expression were dependent upon NADPH oxidase activity. These findings indicate differences in the mechanisms of ROS production by arsenite and UVA that may provide an underlying basis for the observed enhancement of redox-related cellular responses upon combined UVA and arsenite exposure.


Figures

Fig. 1
Fig. 1
Stimulation of MAP kinase signaling by arsenite and UVA. HaCaT cells were treated with 3 μM arsenite (As) or 10kJ/m2 UVA. Dually treated samples were pre-incubated with 3 μM arsenite (As) for 24 hrs and then exposed to UVA. EGF was used as a positive control for MAP kinase activation. Total protein was collected 2 hrs post exposure and 20 μg resolved via a 8-12% SDS-PAGE gradient gel and the indicated proteins were analyzed, transferred to nitrocellulose membrane, immunoreacted with the appropriate antibodies and detected by ECL (A) Blots shown are representative of at least 3 independent experiments. Densitometric analysis of immunoblotting was performed (B). Blots were quantified with a Digital Science Image Station on a Kodak 440CF Imager equipped with ID Image Analysis software. Each bar is the mean of at least 3 independent experiments and the error bars indicate ± S.D. * = significantly different from untreated controls (NT), p<0.05; # = significantly different from singly treated samples, p<0.05.
Fig. 2
Fig. 2
Arsenite and UVA induce cellular ROS. HaCaT cells grown on glass coverslips to 50% confluence were treated with 3 μM arsenite (As), 10kJ/m2 UVA (UVA) or left untreated (NT). Dually treated samples were pre-incubated with 3 μM arsenite (As) for 24 hrs and then exposed to UVA. A superoxide-specific dye (5 μM DHE) was added 30 min. prior to fixation. Samples were rinsed with PBS, fixed using 3.7% para-formaldehyde, mounted on glass slide and observed with fluorescence microscopy 4 hours post UV exposure. Lower panels were treated as described above with the addition of the cell permeable SOD mimic MnTMPyP (sod,5 μM) 30 min. prior to exposures to demonstrate fluorescence is derived from superoxide (A). ROS quantification was carried out as described in “Experimental Procedures.” Each image is representative of multiple observations, and error bars indicate ± S.D. (B). ROS generation was monitored over time and quantified as described in “Experimental Procedures” for untreated or dark (◆), arsenite (■), UVA (▲) and dually treated (●) samples (C). All p values were <0.05 versus the untreated control. * = significantly different from untreated controls (NT), p<0.05; # = significantly different from singly treated samples, p<0.05. DHE, dihydroethidium.
Fig. 3
Fig. 3
Arsenite and UVA cooperate in HO-1 upregulation. HaCaT cells were incubated with 3 μM arsenite (As), 10kJ/m2 UVA (UVA) or left untreated (NT). Dually treated samples were pre-incubated with 3 μM arsenite (As) for 24 hrs and then exposed to UVA. Total protein was collected 4 hrs post exposure and 60 μg resolved via a 12% SDS-PAGE gel. HO-1 was analyzed using anti-HO-1 antibodies and detected by ECL. Equal protein loading was confirmed by reprobing the original membrane with β-Tubulin (A). Blots shown are representative of at least 3 independent experiments. Densitometric analysis of immunoblotting was performed (B). Each bar is the mean of at least 3 independent experiments and the error bars indicate ± S.D. * = significantly different from untreated controls (NT), p<0.05; # = significantly different from singly treated samples, p<0.05.
Fig. 4
Fig. 4
Arsenite and UVA activate NADPH oxidase. HaCaT cells were incubated with 3 μM arsenite (■) or 10kJ/m2 UVA (▲) for the indicated times. NADPH oxidase activity was assessed over time as described in “Experimental Procedures” (A). Total protein was collected at the indicated times and 20 μg resolved via a 8-12% SDS-PAGE gradient gel and the indicated proteins were analyzed, transferred to nitrocellulose membrane, immunoreacted with the appropriate antibodies and detected by ECL. Panel (B) shows results following arsenite treatment and UVA results are shown in (C). Equal protein loading was confirmed by reprobing original membranes with β-tubulin. Each point and blot is representative of at least 3 independent experiments and error bars indicate ± S.D. All p values were <0.05 versus the untreated control. * = significantly different from untreated controls.
Fig. 5
Fig. 5
Contribution of NADPH oxidase and the mitochondria to arsenite- and UVA- induced ROS. HaCaT cells were treated with 3 μM arsenite (■), 10kJ/m2 UVA (▲). DHE was added 30 min. prior to fixation. Samples were rinsed with PBS, fixed using 3.7% para-formaldehyde, mounted on glass slide and observed with fluorescence microscopy. ROS quantification was carried out as described in “Experimental Procedures.” Samples were incubated with apocynin (10 μM) (arsenite + inhibitor (□) or UVA + inhibitor (Δ) 30 min prior to any other treatment for inhibition of NADPH oxidase (A) and rotenone and atpenin A5 (arsenite + inhibitors (□) or UVA + inhibitors (Δ) were added for mitochondrial inhibition (B). Each point is representative of multiple observations, and error bars indicate ± S.D. (A) # = significantly different from uninhibited treatment matched samples, p<0.05. (B) * =significantly different from untreated control; # = significantly different from arsenite or UVA treatment. Comparable results were obtained when employing DPI to inhibit NADPH oxidase. Apocy. = apocynin; DPI = diphenyliodium
Fig. 6
Fig. 6
NADPH oxidase activity is required for arsenite-induced signaling and HO-1 upregulation. HaCaT cells were treated with 3 μM arsenite (As) or 10kJ/m2 UVA (UV). Dually treated samples were incubated with 3 μM arsenite for 24 hrs and then exposed to UVA (As+UVA). Samples were incubated with apocynin (10 μM) 30 min prior to any other treatment for inhibition of NADPH oxidase. Total protein was collected 4 hrs post exposure and 20 μg resolved via 8-12% SDS-PAGE gradient gel and the indicated proteins were analyzed, transferred to nitrocellulose membrane, immunoreacted with the appropriate antibodies and detected by ECL. The effect of NADPH oxidase inhibition on activation of p38 (A). HO-1 upregulation with and without NADPH oxidase inhibition (B). Blots shown are representative of at least 3 independent experiments. Equal protein loading was confirmed by reprobing original membranes with total p38 or β-tubulin as indicated on the figures. Blots were quantified with a Digital Science Image Station on a Kodak 440CF Imager equipped with ID Image Analysis software. Each bar is the mean of at least 3 independent experiments and the error bars indicate ± S.D. * = significantly different from untreated control (NT); # = significantly different from treatment without inhibitor p<0.05. Comparable results were obtained when employing DPI to inhibit NADPH oxidase. Apocy. = apocynin; DPI = diphenyliodium

References

    1. Boukamp P. UV-induced skin cancer: similarities—variations. J Dtsch Dermatol Ges. 2005;3(7):493–503. - PubMed
    1. Nishigori C. Cellular aspects of photocarcinogenesis. Photochem Photobiol Sci. 2006;5(2):208–214. - PubMed
    1. Ahmed NU, Ueda M, Nikaido O, Osawa T, Ichihashi M. High levels of 8-hydroxy-2'-deoxyguanosine appear in normal human epidermis after a single dose of ultraviolet radiation. Br J Dermatol. 1999;140(2):226–231. - PubMed
    1. Nishigori C, Hattori Y, Toyokuni S. Role of reactive oxygen species in skin carcinogenesis. Antioxid Redox Signal. 2004;6(3):561–570. - PubMed
    1. Baudouin C, Charveron M, Tarroux R, Gall Y. Environmental pollutants and skin cancer. Cell Biol. Toxicol. 2002;18:341–348. - PubMed

Publication types

MeSH terms