

From genes to ecosystems: a synthesis of the effects of plant genetic factors across levels of organization
- PMID: 19414474
- PMCID: PMC2690499
- DOI: 10.1098/rstb.2008.0336
From genes to ecosystems: a synthesis of the effects of plant genetic factors across levels of organization
Abstract
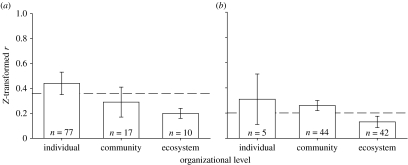
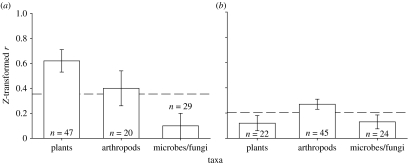
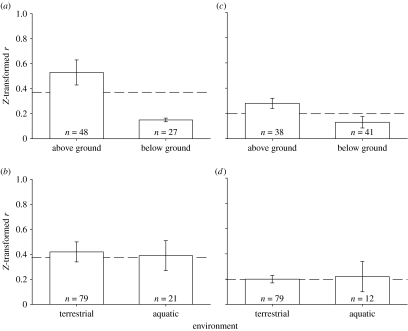
Using two genetic approaches and seven different plant systems, we present findings from a meta-analysis examining the strength of the effects of plant genetic introgression and genotypic diversity across individual, community and ecosystem levels with the goal of synthesizing the patterns to date. We found that (i) the strength of plant genetic effects can be quite high; however, the overall strength of genetic effects on most response variables declined as the levels of organization increased. (ii) Plant genetic effects varied such that introgression had a greater impact on individual phenotypes than extended effects on arthropods or microbes/fungi. By contrast, the greatest effects of genotypic diversity were on arthropods. (iii) Plant genetic effects were greater on above-ground versus below-ground processes, but there was no difference between terrestrial and aquatic environments. (iv) The strength of the effects of intraspecific genotypic diversity tended to be weaker than interspecific genetic introgression. (v) Although genetic effects generally decline across levels of organization, in some cases they do not, suggesting that specific organisms and/or processes may respond more than others to underlying genetic variation. Because patterns in the overall impacts of introgression and genotypic diversity were generally consistent across diverse study systems and consistent with theoretical expectations, these results provide generality for understanding the extended consequences of plant genetic variation across levels of organization, with evolutionary implications.
Figures
References
-
- Adams D.C., Gurevitch J., Rosenberg M.S. Resampling tests for meta-analysis of ecological data. Ecology. 1997;78:1277–1283. doi:10.2307/2265879 - DOI
-
- Bailey J.K., Schweitzer J.A., Rehill B.J., Lindroth R.L., Martinsen G.D., Whitham T.G. Beavers as molecular geneticists: a genetic basis to the foraging of an ecosystem engineer. Ecology. 2004;85:603–608. doi:10.1890/03-3049 - DOI
-
- Bailey J.K., Wooley S.C., Lindroth R.L., Whitham T.G. Importance of species interactions to community heritability: a genetic basis to trophic-level interactions. Ecol. Lett. 2006;9:78–85. doi:10.1111/j.1461-0248.2005.00844.x - DOI - PubMed
-
- Bailey J.K., Irschick D.J., Schweitzer J.A., Rehill B.J., Lindroth R.L., Whitham T.G. Selective herbivory by elk results in rapid shifts in the chemical composition of aspen forests. Biol. Invasions. 2007;9:715–722. doi:10.1007/s10530-006-9071-z - DOI
-
- Bangert R.K., Allan G.J., Turek R.J., Wimp G.M., Meneses N., Martinsen G.D., Keim P., Whitham T.G. From genes to geography: a genetic similarity rule for arthropod community structure at multiple geographic scales. Mol. Ecol. 2006a;15:4215–4228. doi:10.1111/j.1365-294X.2006.03092.x - DOI - PubMed
Publication types
MeSH terms
LinkOut - more resources
Full Text Sources
