

doi: 10.1084/jem.20081621.
Epub 2009 May 4.
A 220-nucleotide deletion of the intronic enhancer reveals an epigenetic hierarchy in immunoglobulin heavy chain locus activation
Affiliations
- PMID: 19414554
- PMCID: PMC2715034
- DOI: 10.1084/jem.20081621
Item in Clipboard
A 220-nucleotide deletion of the intronic enhancer reveals an epigenetic hierarchy in immunoglobulin heavy chain locus activation
J Exp Med.
.
Abstract
A tissue-specific transcriptional enhancer, Emu, has been implicated in developmentally regulated recombination and transcription of the immunoglobulin heavy chain (IgH) gene locus. We demonstrate that deleting 220 nucleotides that constitute the core Emu results in partially active locus, characterized by reduced histone acetylation, chromatin remodeling, transcription, and recombination, whereas other hallmarks of tissue-specific locus activation, such as loss of H3K9 dimethylation or gain of H3K4 dimethylation, are less affected. These observations define Emu-independent and Emu-dependent phases of locus activation that reveal an unappreciated epigenetic hierarchy in tissue-specific gene expression.
Figures
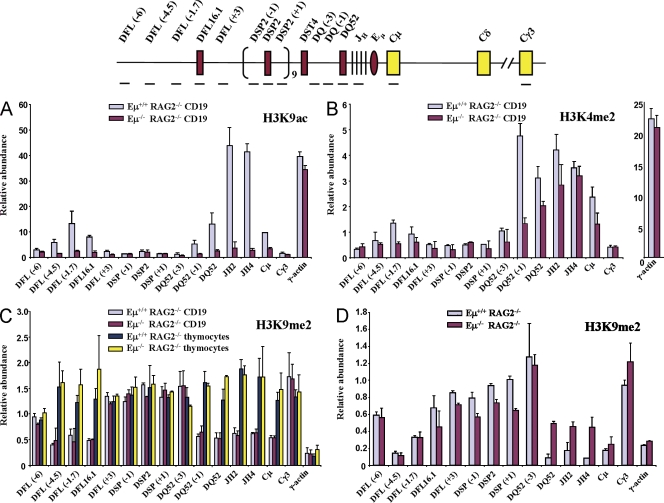
Eμ-dependent histone modifications in the unrearranged IgH locus. (A and B) CD19+ bone marrow pro–B cells from RAG2− and Eμ−RAG2− mice were used in chromatin immunoprecipitation (ChIP) assays using anti-H3K9ac (A) or anti-H3K4me2 (B) antibodies. A typical experiment used cells pooled from six to eight mice of each genotype. Positions of amplicons are indicated in the schematic on the top line; numbers in parentheses indicate position in kb 5′ (−) or 3′ (+) of the nearest DH gene segment. Amplicons from Cγ3 and γ-actin served as negative and positive controls, respectively. Results shown are from three independent cell preparations and immunoprecipitates analyzed in duplicates. Error bars represent standard deviation between experiments. (C and D) H3K9me2 was assayed by ChIP using primary pro–B and pro–T cells (C) or Abelson mouse leukemia virus–transformed pro–B cell lines from RAG2− and Eμ−RAG2− mice (D). Primary pro–B cells were CD19+ bone marrow cells from RAG2− or Eμ−RAG2− mice and primary pro–T cells were CD4−CD8− thymocytes obtained from the same animals. Anti-H3K9me2 antibody was used to coprecipitate genomic DNA from the four cell types followed by quantitative PCR and analysis as described for A and B. Cell lines were obtained by transforming bone marrow cells from mice of each genotype with Abelson virus. Immunoprecipitation and analysis was performed as described for primary cells. The error bars represent the standard deviation between three experiments.
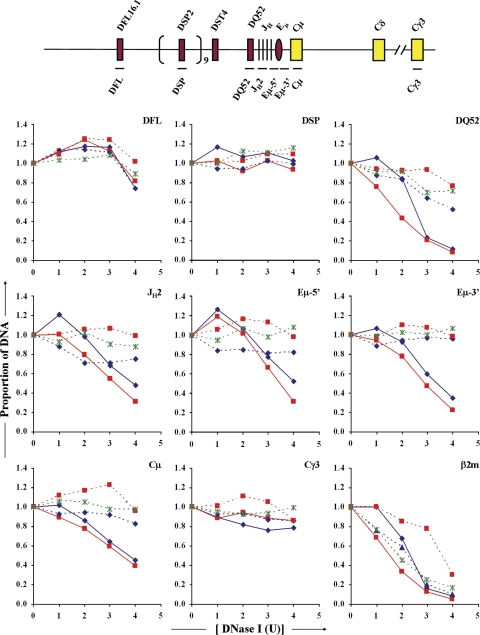
DNase I sensitivity analysis of Eμ+ and Eμ− IgH alleles. Nuclei from Abelson virus–transformed cell lines of the genotypes indicated below were treated with increasing concentrations of DNase I (x axis, DNase I U) followed by purification of genomic DNA. Primer pairs from the DH-Cμ region (shown in the schematic on the top line), the Cγ3 region, the β-globin, and β2-microglobulin (β2m) loci were used in quantitative PCR amplification of equal amounts of genomic DNA. The proportion of DNA for each amplicon (y axis) at each DNase I concentration was normalized to the level of β-globin amplicon at that DNase I concentration, as described in Materials and methods. The resulting value at 0 U DNase I is assigned the value 1 on the y axis. In this method of analysis, the value for the inactive β-globin gene remains at 1 through all concentrations of DNase I used (not depicted). Increased DNase I sensitivity is reflected in loss of signal with increasing DNase I digestion. To score for the Eμ hypersensitive site, we used primer sets located just 5′ (Eμ-5′) and 3′ (Eμ-3′) to the core region that is deleted in Eμ− alleles. Results are shown for three independent DNase I digestion experiments with Eμ−RAG2− cells (dashed lines) and two independent preparations from Eμ+RAG2− cells (solid lines). Each amplicon was analyzed in duplicate and each experiment is denoted by a different color.

Eμ-dependent transcription and transcription-associated histone modifications in the unrearranged IgH locus. Total RNA obtained from bone marrow pro–B cells of the indicated genotypes were converted to complementary DNA using random hexamers and reverse transcription, followed by quantitative PCR using primers from the DH-Cμ region (A) or VH region (D). Amplicon locations are indicated in the schematics that accompany each figure. The numbers in D represent the approximate distance in kilobase between neighboring amplicons. For comparing between genotypes, the data with each primer pair was normalized to the expression level of γ-actin; the DFL16.1 amplicon from A is included in D to provide an indication of transcript levels across the entire IgH locus (note that y axis scales differ between A and D). The data shown is the mean of two independent RNA preparations from each genotype analyzed in duplicates with each primer set. The error bars represent the standard deviation between experiments. Anti-RNA polymerase II (B) and anti-H3K4me3 (C) antibodies were used to immunoprecipitate chromatin from Abelson virus–transformed cell lines (B) or primary pro–B cells (C) of the indicated genotypes. Results shown are from three independent chromatin preparations that were analyzed in duplicate with each primer set. Error bars represent the standard deviation between experiments.
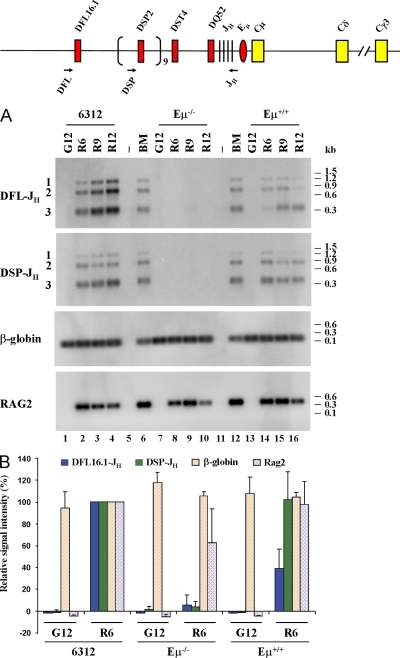
Analysis of DH to JH recombination in Eμ− cells. (A) Abelson virus–transformed Eμ+RAG2− cell lines (6312, lanes 1–4; Eμ+, lanes 13–16) and an Eμ−RAG2− cell line (lanes 7–10) were infected with control (G) or RAG2-expressing (R) retroviruses. Genomic DNA prepared after 6, 9, and 12 d was used to analyze DFL16.1 and DSP2 rearrangements as described in Materials and methods. Location of DH-specific 5′ primers and the common 3′ primer are shown as arrows on the top line. The infection efficiency of the RAG2 virus was 10–15% in 6312 cells as determined by GFP fluorescence. This number could not be determined for Eμ+ or Eμ− cells because all cells were GFP+ before infection. The level of introduced RAG2 in each cell line was determined by PCR amplification of genomic DNA (labeled RAG2). Reactions in lanes 6 and 12 were performed with genomic DNA from total bone marrow cells from a C57BL/6 mouse, and those in lanes 5 and 11 were performed with water to serve as positive and negative control, respectively. An amplicon from the β-globin gene was used to ensure equal DNA usage from all samples. After PCR amplification, the products were fractionated by agarose gel electrophoresis and the products assayed by Southern blotting. Data shown is representative of three independent infection experiments. (B) Signals from control retrovirus-infected day-12 (G12) samples and RAG2 retrovirus-infected day-6 (R6) samples from 6312, Eμ−RAG2−, and Eμ+RAG2− cell lines were quantitated by phosphorimager. Signal intensities from 6312 cells (6312 R6) were taken as 100% and compared with all other samples. Data shown is the mean of three independent infection of each cell line, analyzed in duplicate by PCR and Southern blotting. Error bars represent the standard deviation between experiments.
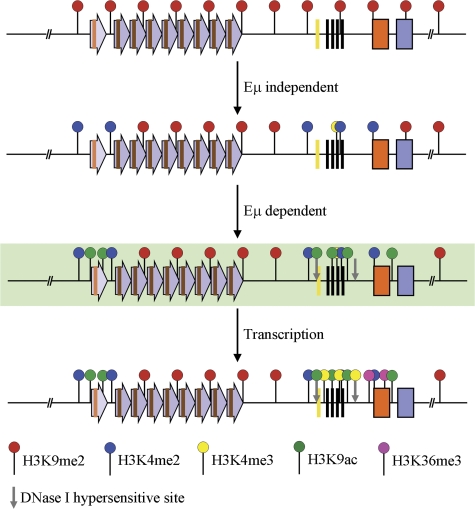
Hierarchical model for epigenetic activation of the IgH locus. The DH-Cμ domain of the germline IgH locus in non–B lineage cells (top line). Purple arrows represent DSP- and DFL16.1-associated repeats; the gene segment is indicated as a brown line within the repeat. DQ52 and JH gene segments are shown as yellow and black vertical lines, respectively. Orange and blue boxes represent Cμ and Cδ exons, respectively. Red balloons identify the repressive H3K9me2 mark. Based on the analysis of core Eμ-deficient alleles, we propose that the first step of lineage-specific locus activation is Eμ independent and results in the configuration shown on line 2. Blue balloons represent H3K4me2, and low level of H3K4me3 is shown as a partial yellow balloon. This partially activated state allows Eμ binding proteins access to the IgH locus, leading to induction of DNase I HS at Eμ and DQ52 (gray vertical arrows, line 3). Eμ binding proteins also recruit histone acetyl transferases, which mark the locus with H3 and H4ac (green balloons, line 3) and RNA polymerase II. Induction of sterile transcription leads to transcription-associated histone modification (HeK4me3 and H3K36me3 marked as yellow and purple balloons, respectively) and a fully activated prerearrangement epigenetic state. Line 3 is shown in a background color to emphasize that this is an inferred intermediate that we have not experimentally characterized. All other lines summarize experimental data described in this paper obtained from pro–T cells (line 1), RAG2-deficient pro–B cells with Eμ-deficient alleles (line 2), and RAG2-deficient pro–B cells with wild-type IgH alleles (line 4).
References
-
- Bulger M., Sawado T., Schubeler D., Groudine M. 2002. ChIPs of the beta-globin locus: unraveling gene regulation within an active domain.Curr. Opin. Genet. Dev. 12:170–177 - PubMed
-
- Felsenfeld G., Burgess-Beusse B., Farrell C., Gaszner M., Ghirlando R., Huang S., Jin C., Litt M., Magdinier F., Mutskov V., et al. 2004. Chromatin boundaries and chromatin domains.Cold Spring Harb. Symp. Quant. Biol. 69:245–250 - PubMed
-
- Bender M.A., Bulger M., Close J., Groudine M. 2000. Beta-globin gene switching and DNase I sensitivity of the endogenous beta-globin locus in mice do not require the locus control region.Mol. Cell. 5:387–393 - PubMed
Publication types
MeSH terms
Substances
Grants and funding
LinkOut - more resources
Full Text Sources
Molecular Biology Databases
