. 2009 May 11;206(5):1073-87.
doi: 10.1084/jem.20082311. Epub 2009 May 4.

Ikaros controls isotype selection during immunoglobulin class switch recombination

Affiliations

Ikaros controls isotype selection during immunoglobulin class switch recombination

MacLean Sellars et al. J Exp Med. .

Abstract

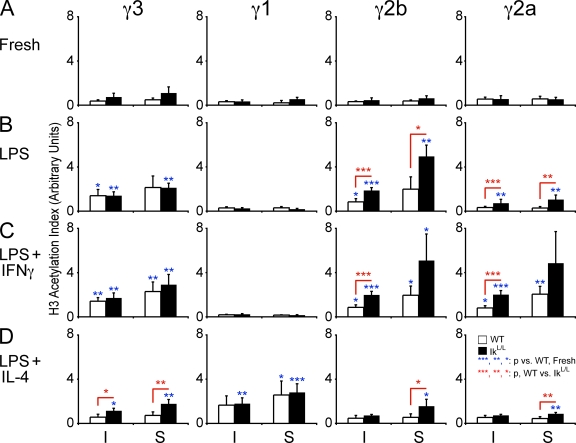
Class switch recombination (CSR) allows the humoral immune response to exploit different effector pathways through specific secondary antibody isotypes. However, the molecular mechanisms and factors that control immunoglobulin (Ig) isotype choice for CSR are unclear. We report that deficiency for the Ikaros transcription factor results in increased and ectopic CSR to IgG(2b) and IgG(2a), and reduced CSR to all other isotypes, regardless of stimulation. Ikaros suppresses active chromatin marks, transcription, and activation-induced cytidine deaminase (AID) accessibility at the gamma2b and gamma2a genes to inhibit class switching to these isotypes. Further, Ikaros directly regulates isotype gene transcription as it directly binds the Igh 3' enhancer and interacts with isotype gene promoters. Finally, Ikaros-mediated repression of gamma2b and gamma2a transcription promotes switching to other isotype genes by allowing them to compete for AID-mediated recombination at the single-cell level. Thus, our results reveal transcriptional competition between constant region genes in individual cells to be a critical and general mechanism for isotype specification during CSR. We show that Ikaros is a master regulator of this competition.


Figures

Figure 1.
Figure 1.
CSR is skewed toward IgG2b and IgG2a in IkL/L B cells. CFSE-labeled B220+ WT and IkL/L B cells were stimulated for 72 h with (A) LPS, (B) LPS + IFN-γ, or (C) LPS + IL-4. (D) 24 h with LPS was followed by 72 h with LPS + IL-5 + TGF-β. CSR was analyzed by FACS, and percentages of Ig+ cells are indicated. The data are representative of more than four independent experiments. Bar graphs represent mean percentages plus SD of switched cells in each condition for four (D) or five (A–C) experiments. Significance was determined by a two-tailed t test assuming unequal variance (***, P < 0.005; **, P < 0.02).
Figure 2.
Figure 2.
Reduced IgE switching in IkL/L B cells despite normal ϵ GLT expression. (A) Iμ-Cϵ transcript expression in B220+ WT and IkL/L B cells after 72 h of stimulation with LPS + IL-4 was analyzed by RT-qPCR. The Iμ promoter is equally active in WT and IkL/L cells (Fig. 4, A–D), indicating that Iμ-Cϵ transcripts can be faithfully compared between genotypes to quantify IgE-switched cells. (B) RT-qPCR for ϵ GLT expression after 48 h of LPS + IL-4 stimulation. Igβ was used as a loading control and all values were normalized to WT. Significance was determined by a two-tailed t test assuming unequal variance (**, P < 0.02). Graphs represent means plus SD of two (A) or three (B) independent experiments. Neither Iμ-Cϵ transcripts nor ϵ GLTs were detected in other conditions (not depicted).
Figure 3.
Figure 3.
Ikaros regulates CSR in mature B cells. CFSE-stained B220+ WT B cells were activated for 24 h with LPS to induce CSR, infected with retroviruses encoding the NGFR reporter alone or with the dominant-negative Ik6 isoform (Ik6-NGFR), and stimulated for another 72 h with LPS. Ig and NGFR expression were analyzed by FACS. Numbers represent percentages of NGFR, NGFR+, or IgG+ cells. The data are representative of four independent experiments (Fig. S5 A provides a statistical analysis).
Figure 4.
Figure 4.
Deregulated expression of γ3, γ2b, and γ2a GLTs in IkL/L B cells. GLTs expressed by B220+ WT and IkL/L B cells that were (A) freshly isolated or stimulated for 48 h with (B) LPS, (C) LPS + IFN-γ, or (D) LPS + IL-4 were analyzed by qPCR. GLTs were normalized to Igβ levels and all values are represented relative to those of unstimulated WT B cells. Graphs represent means plus SD of three independent experiments. Significance was determined by a two-tailed t test assuming unequal variance (***, P < 0.005; **, P < 0.02; *, P < 0.05).
Figure 5.
Figure 5.
AcH4 correlates with transcriptional deregulation in IkL/L B cells. WT and IkL/L CD43 B cells that were (A) freshly isolated or stimulated for 48 h with (B) LPS, (C) LPS + IFN-γ, or (D) LPS + IL-4 were subjected to ChIP with anti-AcH4 antibodies. Graphs represent the mean S region AcH4 enrichment indexes plus SD for three to four independent experiments. Significance was determined by a two-tailed t test assuming unequal variance (***, P < 0.005; **, P < 0.02; *, P < 0.05). AcH4 at Sγ2a was consistently higher in IkL/L versus WT samples after LPS + IFN-γ (Sγ2a IkL/L/WT ratio mean = 1.68; range = 1.21–2.13).
Figure 6.
Figure 6.
Ikaros does not regulate interactions between HS1,2 and CH gene promoters. CD43 WT and IkL/L B cells were analyzed by 3C, either (A) before or after 36 h with (B) LPS, (C) LPS + IFN-γ, or (D) LPS + IL-4. CD4+ T cells stimulated for 36 h with PMA served as a negative control. The y axis represents the relative cross-linking frequency between a HindIII fragment covering HS1,2 and the rest of the locus. Points represent means plus SD of two independent experiments. Significance was determined by a two-tailed t test assuming unequal variance (***, P < 0.005; **, P < 0.02; *, P < 0.05). In A, HS1,2–HS3a and –HS3b/4 cross-linking frequencies in B cells, though similar between genotypes, were too high to be shown.
Figure 7.
Figure 7.
Increased AcH3 at γ3, γ2b, and γ2a in IkL/L B cells. WT and IkL/L CD43 B cells that were (A) freshly isolated or stimulated for 48 h with (B) LPS, (C) LPS + IFN-γ, or (D) LPS + IL-4 were subjected to ChIP with anti-AcH3 antibodies. Graphs represent the mean I exon (I) and S region (S) AcH3 enrichment indexes plus SD for three independent experiments. Significance was determined by a two-tailed t test assuming unequal variance (***, P < 0.005; **, P < 0.02; *, P < 0.05). Sγ2b and Sγ2a AcH3 levels were consistently higher in IkL/L versus WT samples after LPS + IFN-γ (Sγ2b IkL/L/WT ratio mean = 2.68 [range = 1.82–3.47]; Sγ2a IkL/L/WT ratio mean = 2.41 [range = 1.45–3.87]).
Figure 8.
Figure 8.
Ikaros associates with CH promoters and HS1,2 of the 3′ enhancer. WT CD43 B cells that were (A) freshly isolated or stimulated for 48 h with (B) LPS, (C) LPS + IFN-γ, or (D) LPS + IL-4 were subjected to ChIP-qPCR with anti-Ikaros antibodies. Points represent mean Ikaros enrichment, measured as percentage input, plus SD from two to three independent experiments. Approximate amplicon positions relative to transcription start sites or the 5′ ends of HS sites are indicated. Dashed lines represent the mean percentage input for each condition and are defined as the threshold of specific Ikaros binding. (E and F) EMSAs were performed on putative Ikaros binding sites from sequences identified by ChIP (A–D). (E) Nuclear extracts from Cos cells transduced with an empty vector (V) or one encoding the Ik1 isoform (Ik) were incubated with the indicated probes (Table S2). Two putative Iγ1 Ikaros binding sites were tested. (F) The HS1,2 probe was incubated with nuclear extracts from WT or IkL/L B cells stimulated for 36 h with LPS (L), LPS + IL-4 (4), or LPS + IFN-γ (I). Specificity was verified by supershift with anti-Ikaros antibodies. Arrowheads indicate Ikaros complexes. Data in E and F are representative of two independent experiments.
Figure 9.
Figure 9.
Increased S region competition at the SC level for CSR in IkL/L B cells. SC-RT-PCR was performed on IgM+ WT and IkL/L cells after 48 h of stimulation and two divisions (assessed by CFSE dilution). (A and B) Representative data from cohorts of (A) LPS- and (B) LPS + IL-4–stimulated cells are shown. Only actb+ wells were counted (positive control for sorting). Bar graphs represent mean percentages plus SD of cells positive for Aicda, or γ3 or γ2b GLTs, from two independent experiments (0, no cells; 1, one cell; raw data are shown in Table S1). (C) Pie charts represent mean percentages of aicda+ cells expressing GLTs for γ3, γ2b, both, or neither. The numbers of aicda+ cells analyzed over two experiments are indicated (chart centers). (D) Data from C was integrated with GLT expression levels measured by RT-qPCR (Fig. 4, B and D) to give a comprehensive view of γ2b and γ3 GLT expression in individual cells. Pie chart wedges represent the percentages of aicda+ B cells that express the indicated GLTs. Wedge radii are defined such that the wedge area corresponds to total GLT expression levels; γ3 and γ2b GLT levels were normalized to LPS-stimulated WT B cells, for which the radius was set to 1. Thus, the percentage of degrees out of 360 taken by each wedge corresponds to the percentage of expressing cells, and the wedge area corresponds to the integrated per cell expression level.

References

    1. Stavnezer J., Guikema J.E., Schrader C.E. 2008. Mechanism and regulation of class switch recombination.Annu. Rev. Immunol. 26:261–292 - PMC - PubMed
    1. Imai K., Catalan N., Plebani A., Marodi L., Sanal O., Kumaki S., Nagendran V., Wood P., Glastre C., Sarrot-Reynauld F., et al. 2003. Hyper-IgM syndrome type 4 with a B lymphocyte-intrinsic selective deficiency in Ig class-switch recombination.J. Clin. Invest. 112:136–142 - PMC - PubMed
    1. Muramatsu M., Kinoshita K., Fagarasan S., Yamada S., Shinkai Y., Honjo T. 2000. Class switch recombination and hypermutation require activation-induced cytidine deaminase (AID), a potential RNA editing enzyme.Cell. 102:553–563 - PubMed
    1. Revy P., Muto T., Levy Y., Geissmann F., Plebani A., Sanal O., Catalan N., Forveille M., Dufourcq-Labelouse R., Gennery A., et al. 2000. Activation-induced cytidine deaminase (AID) deficiency causes the autosomal recessive form of the Hyper-IgM syndrome (HIGM2).Cell. 102:565–575 - PubMed
    1. Petersen-Mahrt S.K., Harris R.S., Neuberger M.S. 2002. AID mutates E. coli suggesting a DNA deamination mechanism for antibody diversification.Nature. 418:99–103 - PubMed

Publication types

MeSH terms