. 2009 Jul;29(14):3853-66.
doi: 10.1128/MCB.00338-09. Epub 2009 May 4.

Casein kinase 1 delta regulates the pace of the mammalian circadian clock

Affiliations

Casein kinase 1 delta regulates the pace of the mammalian circadian clock

Jean-Pierre Etchegaray et al. Mol Cell Biol. 2009 Jul.

Abstract

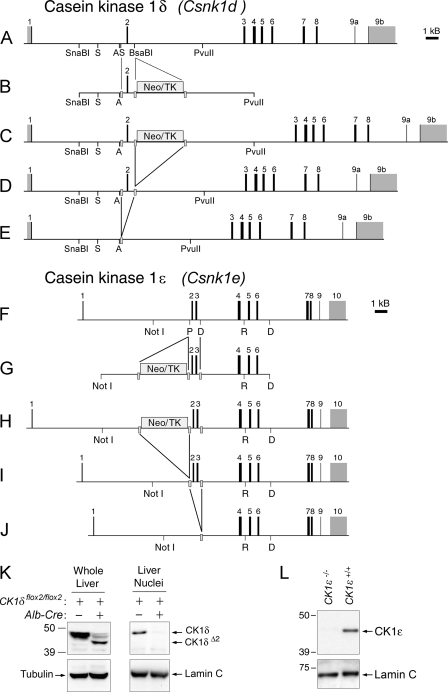
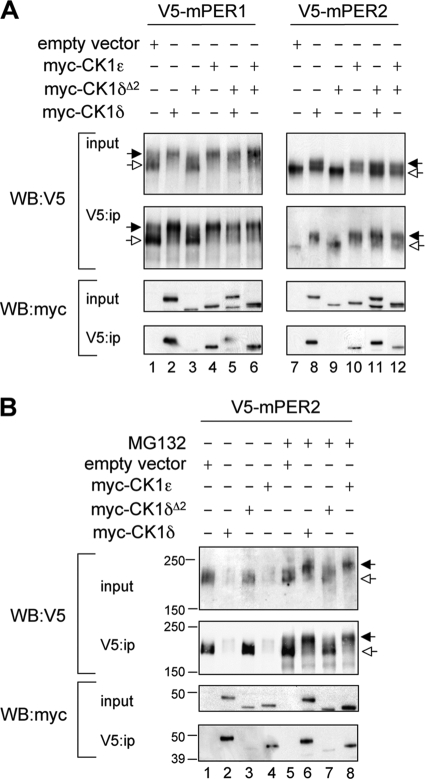
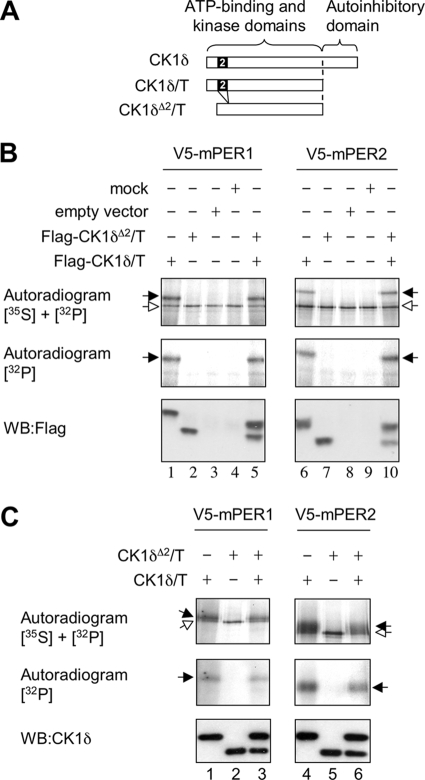
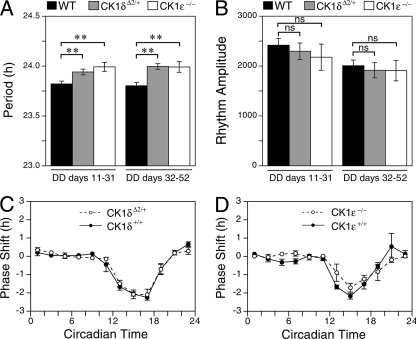
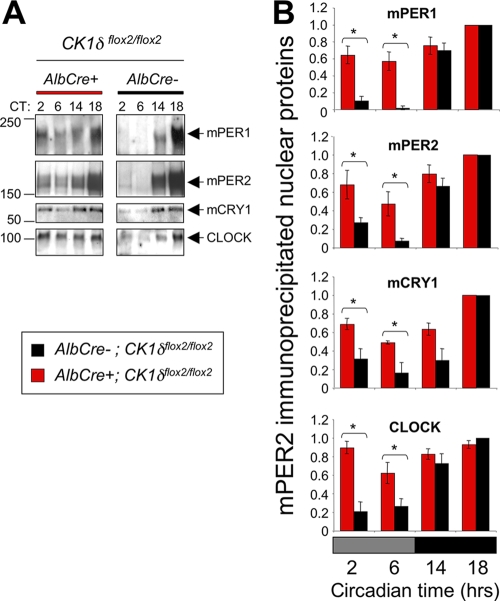
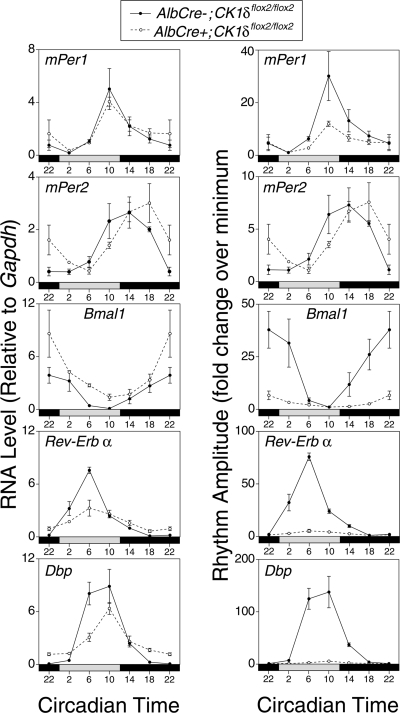
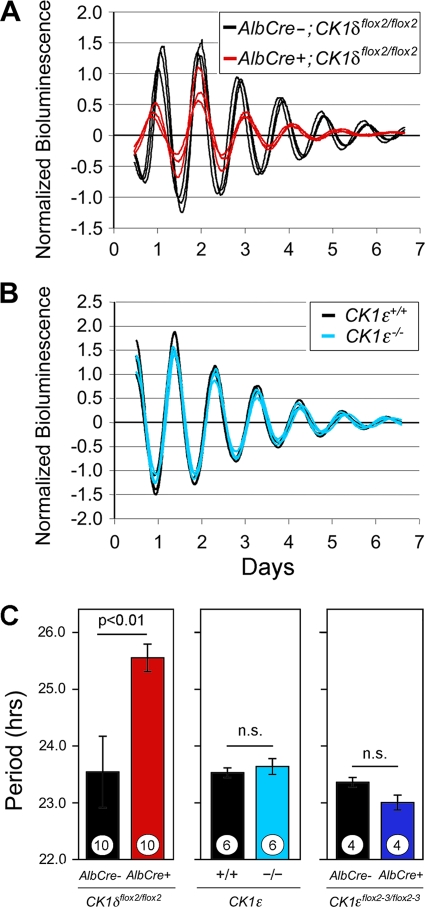
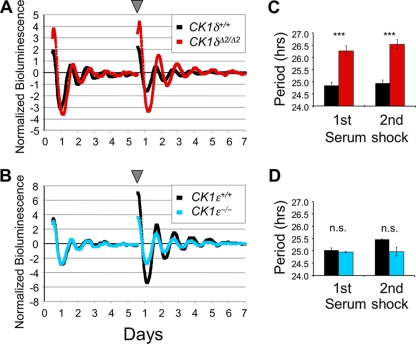
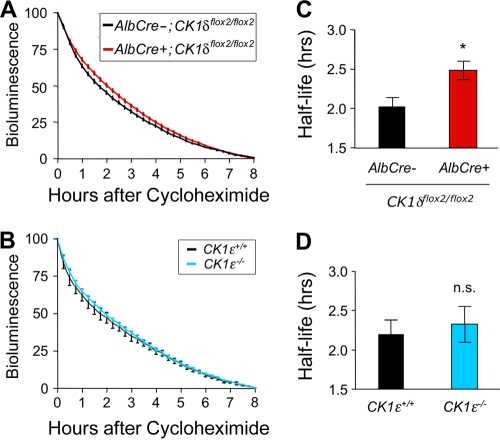
Both casein kinase 1 delta (CK1delta) and epsilon (CK1epsilon) phosphorylate core clock proteins of the mammalian circadian oscillator. To assess the roles of CK1delta and CK1epsilon in the circadian clock mechanism, we generated mice in which the genes encoding these proteins (Csnk1d and Csnk1e, respectively) could be disrupted using the Cre-loxP system. Cre-mediated excision of the floxed exon 2 from Csnk1d led to in-frame splicing and production of a deletion mutant protein (CK1delta(Delta2)). This product is nonfunctional. Mice homozygous for the allele lacking exon 2 die in the perinatal period, so we generated mice with liver-specific disruption of CK1delta. In livers from these mice, daytime levels of nuclear PER proteins, and PER-CRY-CLOCK complexes were elevated. In vitro, the half-life of PER2 was increased by approximately 20%, and the period of PER2::luciferase bioluminescence rhythms was 2 h longer than in controls. Fibroblast cultures from CK1delta-deficient embryos also had long-period rhythms. In contrast, disruption of the gene encoding CK1epsilon did not alter these circadian endpoints. These results reveal important functional differences between CK1delta and CK1epsilon: CK1delta plays an unexpectedly important role in maintaining the 24-h circadian cycle length.


Figures

FIG. 1.
FIG. 1.
CK1δ and CK1ɛ targeting constructs and gene products. (A to E) CK1δ targeting constructs and gene products. (A) CK1δ (Csnk1d) gene. Restriction sites key to the manipulations described in text are indicated (A, AatII; S, StuI). Exons are numbered in reference to coding sequence. (B) Targeting construct. A loxP site (gray bar) was introduced into intron 1 at a StuI site, and a floxed Neo/TK cassette was inserted into intron 2 at a BsaBI site. (C) Targeted allele after homologous recombination in ES cells. (D) Targeted allele after in vitro treatment of ES cells with Cre recombinase to excise the Neo/TK cassette An ES cell clone with this allele (CK1δflox2/+) was microinjected into blastocysts to generate founder chimeras. (E) In vivo excision of exon 2 by Cre recombinase leads to the deleted allele, CK1δΔ2. (F to J) CK1ɛ targeting constructs and gene products. (F) CK1ɛ (Csnk1e) gene. Restriction sites key to the manipulations described in the text are indicated (P, PshAI; D, HinDIII; R, EcoRI). Exons are numbered in reference to coding sequence. (G) Targeting construct. A loxP sites was introduced into intron 3 at a HindIII site, and a floxed Neo/TK cassette was inserted into intron 1 at a PshAI site. (H) Targeted allele after homologous recombination in ES cells. (I) Targeted allele after in vitro treatment of ES cells with Cre recombinase to excise the Neo/TK cassette. An ES cell clone heterozygous for this allele (CK1ɛflox2-3/+) was selected for microinjection. (J) In vivo excision of exons 2 and 3 by Cre recombinase leads to the deleted allele, CK1ɛ. (K) Western blot with an antibody to CK1δ. Samples are from an animal with floxed alleles of CK1δ (AlbCre negative, CK1δflox2/flox2) and an animal with hepatocyte-specific disruption of CK1δ (AlbCre+ CK1δflox2/flox2). In whole-cell extracts (left) a band of more rapid mobility is detected, representing CK1δΔ2 protein. In proteins extracted from liver nuclei (right), CK1δ is readily detected, while the CK1δΔ2 protein appears unable to accumulate in the nucleus. A very small amount of full-length CK1δ protein present in the AlbCre+ CK1δflox2/flox2 sample is likely due to a small population of other cell types (nonhepatocytes) in the liver. In panels K and L, antibodies to α-tubulin and lamin C were used to verify the equivalence of loading of whole-cell and nuclear extract samples, respectively. (L) Western blot of proteins extracted from liver nuclei of a control mouse (CK1ɛ+/+) and a mouse with whole-body disruption of CK1ɛ (CK1ɛ−/−), probed with an antibody to CK1ɛ.
FIG. 2.
FIG. 2.
CK1δΔ2 is a functional null. (A) Assessment of the functional activity of CK1δΔ2 coexpressed with mPER proteins. Myc-tagged casein kinases (CK1δ, CK1ɛ, and CK1δΔ2) and V5-tagged mPER proteins were coexpressed in HEK293 cells (input), and protein complexes were immunoprecipitated with an antibody to V5 (V5:ip). Kinase activity is reflected by an upward mobility shift of mPER proteins (indicated by the filled arrow; seen in the V5 Western blots in lanes 2, 4, 5, 6, 8, and 10, but not in lanes 1, 3, 7, and 9). Hypophosphorylated mPER proteins are indicated by the open arrows. The lower panel shows that myc-tagged CK1δ (lanes 2 and 8) and CK1ɛ (lanes 4 and 10) coprecipitate with the PER proteins, while CK1δΔ2 does not (lanes 3 and 9). Notably, expression of CK1δΔ2 does not interfere with the mobility shift or coprecipitation activities of CK1δ and CK1ɛ (lanes 5, 6, 11, and 12). The results shown are representative of four independent experiments. (B) CK1-mediated proteasomal degradation of mPER2. Cellular coexpression studies similar to those described above were conducted in HEK293 cells, except that a higher concentration of kinase plasmid was used to further promote PER protein degradation. Studies were conducted in the absence (left) or presence (right) of MG132 (10 μM). The black and white arrows indicate hyper- and hypophosphorylated mPER2, respectively. CK1δ and CK1ɛ promote degradation of mPER2 (lanes 2 and 4), while CK1δΔ2 does not (lane 3). In the presence of MG132, hyperphosphorylated mPER2 accumulates rather than being degraded. CK1δ and CK1ɛ promote accumulation of hyperphosphorylated mPER2 (lanes 5 and 7), while CK1δΔ2 does not (lane 6). The results shown are representative of three independent experiments.
FIG. 3.
FIG. 3.
Purified CK1δΔ2 lacks functional activity in vitro. (A) Schematic illustration of constructs in which the autoinhibitory C-terminal domain was removed by truncation of CK1δ at residue 320 (of 415). The CK1δΔ2 construct was truncated at the corresponding residue. (B) In vitro kinase assays reveal that truncated CK1δ phosphorylates PER proteins, whereas CK1δΔ2 does not. The phosphorylation of mPER1 and mPER2 was assessed by in vitro kinase reactions performed in the presence of [γ-32P]ATP. Flag-tagged, truncated CK1δ (CK1δ/Τ), or CK1δΔ2 (CK1δΔ2/T) were expressed in HEK293 cells and purified by using anti-Flag affinity beads. A Flag-tagged empty expression vector was used as a negative control. V5-tagged mPER1 and V5-tagged mPER2 were produced by in vitro translation in the presence of [35S]methionine and purified with anti-V5 antibody. “Mock” samples are TNT-produced PER proteins not subjected to the kinase reaction. The upper panels show an autoradiogram to detect both 35S and 32P incorporated into the V5-tagged proteins. The center panel shows a second autoradiogram revealing 32P incorporated into V5-tagged mPER proteins. (The 35S signal was quenched by placing a second film between the blot and this film.) The lower panel shows a Western blot verifying the expression of Flag-tagged kinase proteins in each sample. Phosphorylated (black arrow) and nonphosphorylated mPER proteins (white arrow) are indicated in the top panel. The truncated CK1δ produces an upward mobility shift of mPER proteins (lanes 1 and 6) and incorporation of 32P. CK1δΔ2 lacks these activities (lanes 2 and 7). These activities of CK1δ were not disrupted by coexpression of CK1δΔ2 (lanes 5 and 10). The results shown are representative of three experiments. (C) His/S-tagged, truncated CK1δ and CK1δΔ2 were expressed in bacteria and purified by immunoprecipitation. V5-tagged mPER1 and V5-tagged mPER2 were produced in rabbit reticulocyte lysates in the presence of 35S and purified with anti-V5 antibody. In vitro kinase reactions were performed in the presence of [γ-32P]ATP. The upper panels show an autoradiogram revealing both 35S and 32P incorporated into the V5-tagged mPER proteins. The center panels show autoradiograms of 32P incorporated into V5-tagged mPER proteins, with the 35S signal quenched by another film. Phosphorylated (black arrow) and nonphosphorylated (white arrow) mPER proteins are indicated in the top panel. The lower panel shows a Western blot with an antibody to CK1δ, verifying the expression of kinase proteins in each sample. The truncated CK1δ produces an upward mobility shift of mPER proteins (lanes 1,4) and the incorporation of 32P. CK1δΔ2 lacks these activities (lanes 2 and 5). These activities of CK1δ were not disrupted by coexpression of CK1δΔ2 (lanes 3 and 6). (Note that the PER input amounts were lower in lanes 3 and 6 than in lanes 1 and 4, as revealed by the lower intensity of the hypophosphorylated band of the upper autoradiogram. Notably, the ratio of signal in the two autoradiograms for each lane was roughly equal.) The results shown are representative of three experiments.
FIG. 4.
FIG. 4.
Locomotor activity rhythms in casein kinase mutant mice. (A) Mean period length. (B) Rhythm amplitude. Rhythm parameters were determined for two consecutive 21-day epochs in constant darkness (DD) for wild-type control mice (WT; n = 27), CK1δΔ2/+ mice, (n = 21), and CK1e−/− mice (n = 9). Asterisks indicate a significant effect of genotype within each period of study (P < 0.01, Dunnett's test). The rhythm amplitude did not differ between the genotypes (P > 0.05). (C and D) Phase-shifting responses to 1-h light pulses were similar among CK1δΔ2/+ mice, CK1e−/− mice, and wild-type control mice. Values are the mean ± the standard error of the mean (SEM) of 2 to 12 (average of 6) pulses per bin per genotype.
FIG. 5.
FIG. 5.
Hepatic protein rhythms in CK1-deficient liver. (A) Altered protein rhythms in CK1δ-deficient liver nuclei. Liver nuclei prepared at four time points on the first day in constant darkness were probed to detect circadian proteins by Western blotting. Liver tissue was collected at the indicated circadian times (CT) from CK1δ-deficient livers (AlbCre+; CK1δflox2/flox2) and control livers (AlbCre negative; CK1δflox2/flox2). Rhythms of circadian proteins were present in CK1δ-deficient livers, but the rhythms were blunted in amplitude due to the presence of higher levels of mPER1, mPER2, and CRY1 proteins during the subjective day (CT2 and CT6). The results shown are representative of at least four experiments. (B) Quantitative analysis of hepatic protein rhythms from CK1δ-deficient livers. Relative nuclear protein levels were calculated by densitometric analysis of Western blots; data were first expressed relative to Pol II, and the maximum protein/Pol II ratio in each experiment was set to 1.0. Other values are expressed relative to this maximum. Each panel includes values from four (mCRY1) or five independent experiments generated from different tissue samples. Asterisks indicate significant difference between the genotypes at P < 0.05. (C) Unaltered protein rhythms in liver nuclei from CK1ɛ-deficient mice. Liver nuclei prepared at four circadian times on the first day in constant darkness were probed to detect circadian proteins. Rhythms of circadian proteins were present in CK1ɛ-deficient livers, and these rhythms did not differ from the rhythms in wild-type mice. The results shown are representative of three experiments, each involving different tissue samples. (D) Quantitative analysis of hepatic protein rhythms in CK1ɛ-deficient mice. Nuclear proteins from mice with whole-body disruption of CK1ɛ (CK1ɛ−/−) and wild-type controls (CK1ɛ+/+) were assessed. Three Western blots for each protein (as shown in Fig. 3C) were analyzed as described in panel B, above.
FIG. 6.
FIG. 6.
Nuclear repressor complex levels are increased during subjective day in CK1δ-deficient liver tissues. (A) Nuclear protein extracts were purified from CK1δ-deficient (AlbCre+; CK1δflox2/flox2) and control (AlbCre; CK1δflox2/flox2) livers collected at the indicated circadian times, and protein complexes were isolated by immunoprecipitation of mPER2. Then, mPER1, mPER2, mCRY1, and CLOCK were detected by Western blotting. Representative of three independent immunoprecipitations. (B) Quantification of three replicate immunoprecipitation experiments. Asterisks indicate significant differences between the genotypes at P < 0.05.
FIG. 7.
FIG. 7.
Transcript rhythms in CK1δ-deficient liver. Liver tissues were collected at six times on the first day in constant darkness, and RNA levels were assessed by real-time PCR. Panels on the left show RNA levels expressed relative to GAPDH. Panels on the right show the data from the same samples, plotted as the RNA amplitude (where each value is expressed relative to the nadir value during the circadian cycle for each genotype). Expression of the data as rhythm amplitude reveals a dramatic impact on the amplitude of the output genes Rev-Erbα and Dbp. Elevation of Bmal1 is expected due to the reduced levels of Rev-Erbα. Each value represents the mean (± the SEM) of three tissue samples assessed in duplicate, except the AlbCre+ group at CT2, where n = 2. An independent tissue collection and real-time PCR analysis of mPer1, mPer2, Rev-Erbα, and Dbp gave similar results.
FIG. 8.
FIG. 8.
mPER2::LUC bioluminescence rhythms in liver explants from kinase-mutant mice. (A) Bioluminescence recordings from CK1δ-deficient liver explants (AlbCre+; CK1δflox2/flox2; Per2luc/+) and from control mice (AlbCre; CK1δflox2/flox2; Per2luc/+). (B) Bioluminescence recordings from liver explants of CK1ɛ-deficient mice (CK1ɛ−/−; Per2luc/+) and control mice (CK1ɛ+/+; Per2luc/+). (A and B) Each panel shows three representative profiles from a single experiment. Day 0 is the day of explant preparation. The data were normalized to the average bioluminescence level over the duration of the experiment and are plotted as the difference from the centered 24-h moving average. The reduced amplitude and duration of rhythmicity in CK1δ-deficient liver explants seen in this example was not seen consistently in other experiments. (C) Mean ± SEM values for circadian cycle length (period) of the mPER2::LUC bioluminescence rhythms recorded from kinase-deficient liver explants. Values plotted within each panel represent experiments conducted simultaneously and thus are directly comparable. Significance levels are indicated within each panel. Sample sizes within each bar represent the number of animals from which explants were studied.
FIG. 9.
FIG. 9.
mPER2::LUC bioluminescence rhythms in kinase-deficient primary MEFs. (A and B) Representative mPER2::LUC bioluminescence rhythms recorded from MEF cultures of different genotypes. On days 0 and 5 (arrowhead), a serum shock was administered to synchronize the cells. Bioluminescence recordings from CK1δ-deficient (CK1δΔ22) and control (CK1δ+/+) MEFs (A) and CK1ɛ-deficient mice (CK1ɛ−/−) and control (wild-type, CK1ɛ+/+) MEFs (B). (C and D) Mean circadian period of mPER2::LUC bioluminescence rhythms recorded from kinase-deficient MEFs. (C) The period of CK1δ-deficient MEFs was significantly longer than in controls (***, P < 0.001 [Student t test]). (D) The period of CK1ɛ-deficient MEFs did not differ from controls (n.s., P > 0.05). Values are the means ± the SEM of three independent experiments in each panel.
FIG. 10.
FIG. 10.
mPER2::LUC bioluminescence half-life is increased by disruption of CK1δ but is unaffected by the absence of CK1ɛ. (A and B) Liver explants were treated with cycloheximide (80 μg/ml) at the time of peak bioluminescence on the first day in vitro, and the decline in bioluminescence was monitored for 8 h. The data were normalized to the peak level of mPER2::LUC bioluminescence and the minimum level after 8 h of recording. Values are plotted as means ± the SEM. (A) Average bioluminescence profiles from explants from CK1δ-deficient liver (AlbCre+; CK1δflox2/flox2; mPer2Luc/+) (n = 12) and control liver (AlbCre; CK1δflox2/flox2; mPer2Luc/+) (n = 7) tissues. (B) Average bioluminescence profiles from liver explants from CK1ɛ-deficient livers and wild-type (CK1ɛ+/+; mPer2Luc/+) controls (n = 8 per genotype). (C) The calculated bioluminescence half-life was significantly (*, P < 0.025) increased in CK1δ-deficient livers, relative to controls lacking Cre recombinase. (D) mPER2::LUC bioluminescence half-life was unaltered in CK1ɛ-deficient livers.

References

    1. Agostino, P. V., S. A. Plano, and D. A. Golombek. 2008. 2008. Circadian and pharmacological regulation of casein kinase I in the hamster suprachiasmatic nucleus. J. Genet. 87467-471. - PubMed
    1. Akashi, M., Y. Tsuchiya, T. Yoshino, and E. Nishida. 2002. Control of intracellular dynamics of mammalian period proteins by casein kinase I ɛ (CKIɛ) and CKIδ in cultured cells. Mol. Cell. Biol. 221693-1703. - PMC - PubMed
    1. Badura, L., T. Swanson, W. Adamowicz, J. Adams, J. Cianfrogna, K. Fisher, J. Holland, R. Kleiman, F. Nelson, L. Reynolds, K. St Germain, E. Schaeffer, B. Tate, and J. Sprouse. 2007. An inhibitor of casein kinase I epsilon induces phase delays in circadian rhythms under free-running and entrained conditions. J. Pharmacol. Exp. Ther. 322730-738. - PubMed
    1. Balsalobre, A., F. Damiola, and U. Schibler. 1998. A serum shock induces circadian gene expression in mammalian tissue culture cells. Cell 93929-937. - PubMed
    1. Blau, J. 2008. PERspectives on PER phosphorylation. Genes Dev. 221737-1740. - PMC - PubMed

Publication types

MeSH terms