. 2009 Jul;29(13):3722-37.
doi: 10.1128/MCB.01164-08. Epub 2009 May 4.

A Twist-Snail axis critical for TrkB-induced epithelial-mesenchymal transition-like transformation, anoikis resistance, and metastasis

Affiliations

A Twist-Snail axis critical for TrkB-induced epithelial-mesenchymal transition-like transformation, anoikis resistance, and metastasis

Marjon A Smit et al. Mol Cell Biol. 2009 Jul.

Abstract

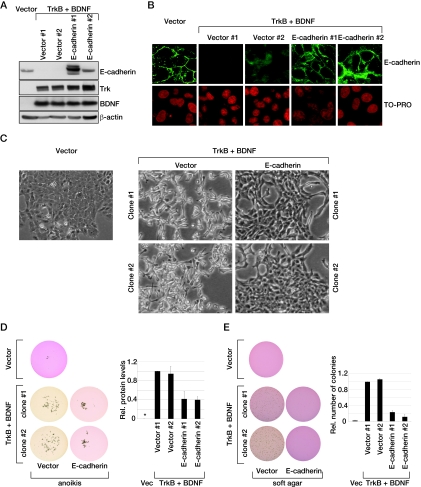
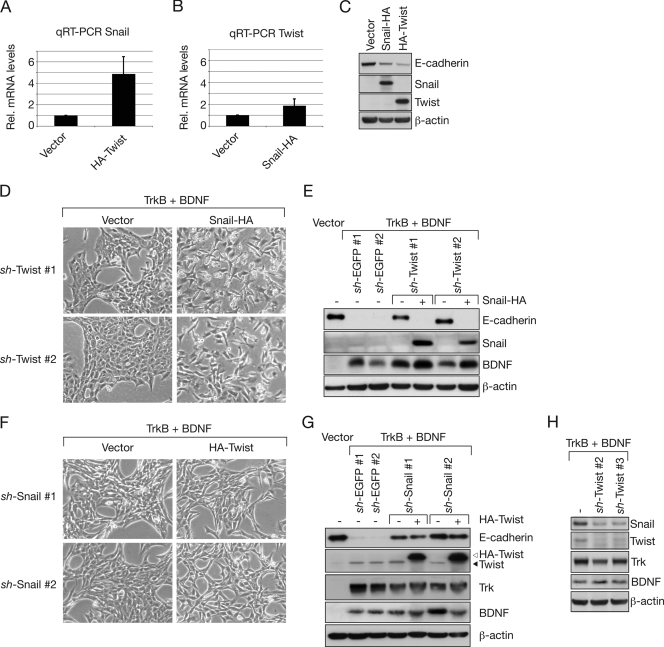
In a genomewide anoikis suppression screen for metastasis genes, we previously identified the neurotrophic receptor tyrosine kinase TrkB. In mouse xenografts, activated TrkB caused highly invasive and metastatic tumors. Here, we describe that TrkB also induces a strong morphological transformation, resembling epithelial-mesenchymal transition (EMT). This required TrkB kinase activity, a functional mitogen-activated protein kinase pathway, suppression of E-cadherin, and induction of Twist, a transcription factor contributing to EMT and metastasis. RNA interference (RNAi)-mediated Twist depletion blocked TrkB-induced EMT-like transformation, anoikis suppression, and growth of tumor xenografts. By searching for essential effectors of TrkB-Twist signaling, we found that Twist induces Snail, another EMT regulator associated with poor cancer prognosis. Snail depletion impaired EMT-like transformation and anoikis suppression induced by TrkB, but in contrast to Twist depletion, it failed to inhibit tumor growth. Instead, Snail RNAi specifically impaired the formation of lung metastases. Epistasis experiments suggested that Twist acts upstream from Snail. Our results demonstrate that TrkB signaling activates a Twist-Snail axis that is critically involved in EMT-like transformation, tumorigenesis, and metastasis. Moreover, our data shed more light on the epistatic relationship between Twist and Snail, two key transcriptional regulators of EMT and metastasis.


Figures

FIG. 1.
FIG. 1.
TrkB induces EMT-like transformation in epithelial cells. (A) Mesenchymal morphology induced by overexpression of TrkB and BDNF in epithelial RIE-1, RK3E, and MCF10A cells. (B) Effect on expression of epithelial and mesenchymal markers by TrkB and BDNF, as analyzed by Western blotting. V, vector; TB, TrkB and BDNF; sm-actin, smooth muscle actin. β-actin serves as the loading control. (C) TrkB and BDNF induce downregulation of E-cadherin mRNA levels and upregulation of N-cadherin mRNA levels in RIE-1 and RK3E cells (measured by qRT-PCR; n = 3; error bars represent standard deviations). Rel., relative. (D) Effect of TrkB-BDNF on the transcription factors Twist, Snail, and Slug in RIE-1 and RK3E cells, as measured by qRT-PCR (n = 3; error bars represent standard deviations). (E) Downregulation of BMP-4 and CTGF mRNA levels by TrkB and BDNF, as measured by qRT-PCR (n = 3; error bars represents standard deviations).
FIG. 2.
FIG. 2.
Continuous TrkB signaling is required for the EMT-like transformation and survival of RK3ETB cells. (A) Kinase-inactive TrkBK588M does not change the epithelial morphology of RK3E cells. Wild-type TrkB, TrkBwt. (B) Kinase-inactive TrkBK588M does not affect E-cadherin protein levels, as shown by Western blot analysis. (C) Stimulation of TrkB-expressing RK3E cells with recombinant BDNF induces morphological transformation within 2 days, which is reverted back to an epithelial morphology after removal of BDNF for 3 days. (D) Western blot analysis of the cells described in the legend to panel C. (E) RK3ETB cells treated overnight with the Trk inhibitor K252a show increased cell death, as measured by trypan blue exclusion. The average of three independent experiments is shown, and error bars indicate standard deviations. TB, TrkB and BDNF. (F) RK3ETB cells treated overnight with the Trk inhibitor K252a show cleaved caspase 3, and K252a inhibits autophosphorylation of TrkB and BDNF-induced phosphorylation of ERK, all determined by Western blot analysis. β-actin serves as the loading control for all Western blots. TB, TrkB and BDNF. (G) Cells growing in serum-reduced medium (1% FCS) were treated with BDNF for 2 days. Cells were harvested 1 day after BDNF was removed from the medium. Apoptotic cells in the supernatant were included in the analysis for panels E, F, and G.
FIG. 3.
FIG. 3.
Loss of E-cadherin is an essential feature of TrkB function. (A) Western blot analysis of E-cadherin, TrkB, and BDNF from independent cell clones expressing indicated cDNAs. β-actin serves as the loading control. (B) Overexpressed E-cadherin localizes at the cell membrane, as shown by indirect immunofluorescence and confocal microscopy. TO-PRO stains DNA. (C) Epithelial morphology induced by overexpression of E-cadherin in RK3ETB cells. (D) E-cadherin restoration impairs TrkB-mediated anoikis suppression. Vector or RK3ETB cells and derived cell clones overexpressing E-cadherin or vector control were cultured on ULC plates for 4 days and scanned at a magnification of ×1 (left) or quantified by measuring protein levels (right) (n = 3; error bars represent standard deviations). An asterisk indicates a measured value of 0. Rel., relative; Vec, vector. (E) E-cadherin restoration impairs TrkB-mediated anchorage-independent growth. A total of 1,000 cells expressing the indicated cDNAs were grown in 0.4% agarose for 11 days; a scan with a magnification of ×1 (left) and its quantification (right) are shown (error bars represent the standard deviations of an experiment done in triplicate).
FIG. 4.
FIG. 4.
Twist is required for TrkB-induced EMT and tumorigenesis. (A) Induction of Twist protein levels in TrkB and BDNF-expressing RK3E cells, analyzed by Western blotting. V, vector; TB, TrkB and BDNF. CDK4 serves as the loading control. (B) sh-Twist prevents morphological transformation of RK3E cells by TrkB and BDNF. (C) sh-Twist prevents downregulation of E-cadherin by TrkB and BDNF in RK3E cells, as shown by Western blot analysis for the indicated proteins. β-actin serves as the loading control. (D) E-cadherin localizes at the cell membrane of RK3ETB cells upon Twist depletion, as shown by immunofluorescence (TO-PRO stains DNA). (E) sh-Twist impairs TrkB-mediated tumorigenesis. BALB/c nude mice were subcutaneously injected with 1 × 10⁵ RK3ETB cells plus the indicated shRNAs into each flank. Growth curves for average tumor volumes are shown, with 8 tumors for sh-EGFP #1, sh-EGFP #2, and sh-Twist #1 and 11 tumors for sh-Twist #2. Error bars represent the standard errors of the mean. An asterisk indicates a P value of <0.01 in a two-sided Student t test. (F) Effect of sh-Twist on experimental metastasis. Mice were intravenously injected with 1 × 10⁶ RK3ETB cells plus the indicated shRNAs. Mice were euthanized when clinical symptoms became apparent, with four mice from each cell line. Significance values were obtained by first combining the data from both shRNAs against the same gene (EGFP or Twist) and subsequently performing a log rank test.
FIG. 5.
FIG. 5.
TrkB-induced EMT-like transformation is mediated via the MAPK pathway. (A) Downregulation of phospho-ERK (pERK) upon treatment with U0126. Cells were serum starved for 4 h, pretreated with 20 μM U0126 for 30 min, and stimulated with 50 ng/ml BDNF for 5 min. Cells were harvested in the presence of phosphatase inhibitors. (B) Induction of Twist in RK3ETB cells requires an intact MAPK pathway, as shown by Western blot analysis. Cells were treated overnight with 20 μM U0126 and analyzed by Western blot analysis. Two parts derived from the same gel are shown. TB, TrkB and BDNF. (C) TrkB-induced EMT-like transformation is dependent on the MAPK pathway. RK3ETB cells were treated with 20 μM U0126 for 2 days and analyzed by Western blotting. (D) Morphology of the cells described in the legend to panel C. (E) HA-Twist or Snail-HA overexpression in RK3ETB cells partially prevented the reversion to an epithelial morphology induced by U0126 treatment for 2 days. (F) Western blot analysis of cells described in the legend to panel E. (G) Downregulation of pAKT upon treatment with PI-103. Cells were serum starved for 4 h, pretreated with 500 nM PI-103 for 30 min, and stimulated with 50 ng/ml BDNF for 5 min. Cells were harvested in the presence of phosphatase inhibitors. (H) Induction of Twist in RK3ETB cells is not dependent on the PI3K pathway. Cells were treated overnight with 500 nM PI-103 and analyzed by Western blotting. (I) TrkB-induced EMT-like transformation is not dependent on the PI3K pathway. Cells were treated with 500 nM PI-103 for 2 days and analyzed by Western blotting. (J) Morphology of cells described in the legend to panel I. β-actin serves as the loading control for all Western blots.
FIG. 6.
FIG. 6.
Snail is required for TrkB-induced EMT-like transformation, anoikis resistance, and anchorage-independent growth. (A) Increased protein levels of Snail in TrkB and BDNF-expressing MCF10A cells, as judged by Western blotting of the indicated proteins. (B) Snail knockdown in RK3ETB cells, as measured by qRT-PCR (n = 3; error bars represent standard deviations). Rel., relative. (C) sh-Snail prevents morphological transformation of RK3E cells by TrkB and BDNF. Photographs shown here and in Fig. 4B are derived from the same experiment. (D) sh-Snail prevents downregulation of E-cadherin by TrkB and BDNF in RK3E cells, as judged by Western blotting of the indicated proteins. (E) E-cadherin localizes at the cell membrane of RK3ETB cells upon Snail depletion, as shown by immunofluorescence (TO-PRO stains DNA). Pictures shown here and in Fig. 4D are derived from the same experiment. (F) sh-Snail impairs TrkB-mediated anoikis suppression. RK3E cells expressing the indicated cDNAs were cultured on ULC plates and scanned at a magnification of ×1 after 4 days (left) or quantified by determining the total protein levels (right) (n = 3; error bars represent standard deviations). Pictures shown here and in Fig. S2A in the supplemental material are derived from the same experiment. (G) Snail is involved in TrkB-induced migration and invasion, as determined by migration and invasion assays. A total of 250,000 freshly trypsinized cells were seeded on control inserts (for migration) or Matrigel (for invasion), and cells that translocated toward a serum gradient were counted 24 h later. Error bars represent the standard deviations of three independent experiments. Graphs shown here and in Fig. S2B in the supplemental material were derived from the same experiment. (H) sh-Snail impairs TrkB-mediated anchorage-independent growth. A total of 1,000 RK3E cells expressing the indicated cDNAs were grown in 0.4% agarose for 11 days; magnification of ×1 (left) and quantification of the number of colonies (right) are shown. β-actin serves as the loading control for all Western blots.
FIG. 7.
FIG. 7.
Snail is required for TrkB-induced metastasis. (A) sh-Snail does not affect TrkB-induced tumorigenesis. BALB/c nude mice were subcutaneously injected with 1 × 10⁵ RK3ETB cells plus the indicated shRNAs into each flank. Growth curves for average tumor volumes are shown; n = 8 tumors for all cell lines. Error bars represent standard errors of the mean. Curves shown here and in Fig. 4E were derived from the same experiment. (B) Hematoxylin- and eosin-stained histological sections of lungs from the mice described in the legend to panel A, showing metastatic tumor lesions. (C) Quantification of lung metastases from mice described in the legend to panel A. Lesions of ≥0.1 mm were counted from 17 to 23 slides per cell line. Bar diagram shows the average values from three experiments, and error bars represent standard deviations. (D) Effect of sh-Snail on experimental metastasis. Mice were intravenously injected with 1 × 10⁶ RK3ETB cells expressing the indicated shRNAs. Mice were euthanized when clinical symptoms became apparent; n = 4 mice for each cell line. Significance values were obtained by first combining the data from both shRNAs against the same gene (EGFP or Snail) and subsequently performing a log rank test. Curves shown here and in Fig. 4F were derived from the same experiment.
FIG. 8.
FIG. 8.
Snail acts downstream from Twist. (A) Induction of Snail mRNA by overexpression of HA-Twist in RK3E cells, as measured by qRT-PCR (n = 3; error bars represent standard deviations). Rel., relative. (B) mRNA levels of Twist in RK3E cells overexpressing Snail-HA, measured by qRT-PCR (n = 3; error bars represent standard deviations). (C) Snail-HA and HA-Twist are both expressed at high levels and downregulate E-cadherin, as showed by Western blot analysis. (D) Functional rescue of cell morphology by overexpression of Snail-HA in RK3ETB cells expressing sh-Twist. (E) Western blot analysis for E-cadherin, Snail, and BDNF of the cells used for panel D. (F) No morphological change by overexpression of HA-Twist in RK3ETB cells plus sh-Snail. (G) Western blot analysis for E-cadherin, Twist, and other proteins, as indicated by the cells used for panel F. The open arrowhead indicates ectopic HA-Twist, and the filled arrowhead indicates endogenous Twist. (H) Snail protein levels are downregulated upon Twist knockdown in TrkB- and BDNF-expressing MCF10A cells, as measured by Western blot analysis. β-actin serves as the loading control for all Western blots.
FIG. 9.
FIG. 9.
Model depicting a critical TrkB effector pathway contributing to EMT, anoikis suppression, and metastasis. TrkB activation leads to induction of both Twist and Snail. These transcription factors repress E-cadherin, thereby inducing EMT and anoikis suppression and facilitating metastasis. Twist, acting upstream from Snail, conceivably has additional targets, including those that are primarily required for tumor growth. For simplicity, only the functional and epistatic relationships that are addressed in this paper are indicated. We do not exclude other upstream and downstream factors and feedback loops that may be present.

References

    1. Barrett, S. D., A. J. Bridges, D. T. Dudley, A. R. Saltiel, J. H. Fergus, C. M. Flamme, A. M. Delaney, M. Kaufman, S. LePage, W. R. Leopold, S. A. Przybranowski, J. Sebolt-Leopold, K. Van Becelaere, A. M. Doherty, R. M. Kennedy, D. Marston, W. A. Howard, Jr., Y. Smith, J. S. Warmus, and H. Tecle. 2008. The discovery of the benzhydroxamate MEK inhibitors CI-1040 and PD 0325901. Bioorg. Med. Chem. Lett. 186501-6504. - PubMed
    1. Batlle, E., E. Sancho, C. Franci, D. Dominguez, M. Monfar, J. Baulida, and A. Garcia De Herreros. 2000. The transcription factor snail is a repressor of E-cadherin gene expression in epithelial tumour cells. Nat. Cell Biol. 284-89. - PubMed
    1. Becker, K. F., E. Rosivatz, K. Blechschmidt, E. Kremmer, M. Sarbia, and H. Hofler. 2007. Analysis of the E-cadherin repressor Snail in primary human cancers. Cells Tissues Organs 185204-212. - PubMed
    1. Behrens, J., M. M. Mareel, F. M. Van Roy, and W. Birchmeier. 1989. Dissecting tumor cell invasion: epithelial cells acquire invasive properties after the loss of uvomorulin-mediated cell-cell adhesion. J. Cell Biol. 1082435-2447. - PMC - PubMed
    1. Behrens, J., K. M. Weidner, U. H. Frixen, J. H. Schipper, M. Sachs, N. Arakaki, Y. Daikuhara, and W. Birchmeier. 1991. The role of E-cadherin and scatter factor in tumor invasion and cell motility. EXS 59109-126. - PubMed

Publication types

MeSH terms