Multicenter Study
. 2009 Jun 1;27(16):2660-7.
doi: 10.1200/JCO.2008.18.7906. Epub 2009 May 4.

Genome-wide analysis of survival in early-stage non-small-cell lung cancer

Affiliations
Multicenter Study

Genome-wide analysis of survival in early-stage non-small-cell lung cancer

Yen-Tsung Huang et al. J Clin Oncol. .

Abstract

Purpose: Lung cancer, of which 85% is non-small-cell (NSCLC), is the leading cause of cancer-related death in the United States. We used genome-wide analysis of tumor tissue to investigate whether single nucleotide polymorphisms (SNPs) in tumors are prognostic factors in early-stage NSCLC.

Patients and methods: One hundred early-stage NSCLC patients from Massachusetts General Hospital (MGH) were used as a discovery set and 89 NSCLC patients collected by the National Institute of Occupational Health, Norway, were used as a validation set. DNA was extracted from flash-frozen lung tissue with at least 70% tumor cellularity. Genome-wide genotyping was done using the high-density SNP chip. Copy numbers were inferred using median smoothing after intensity normalization. Cox models were used to screen and validate significant SNPs associated with the overall survival.

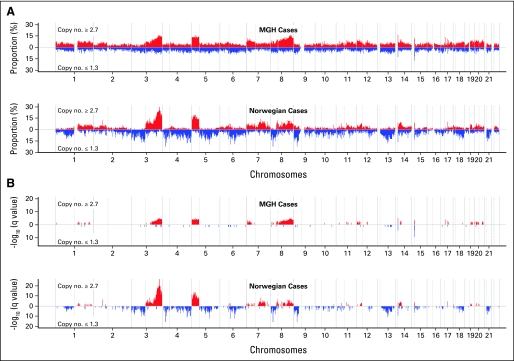
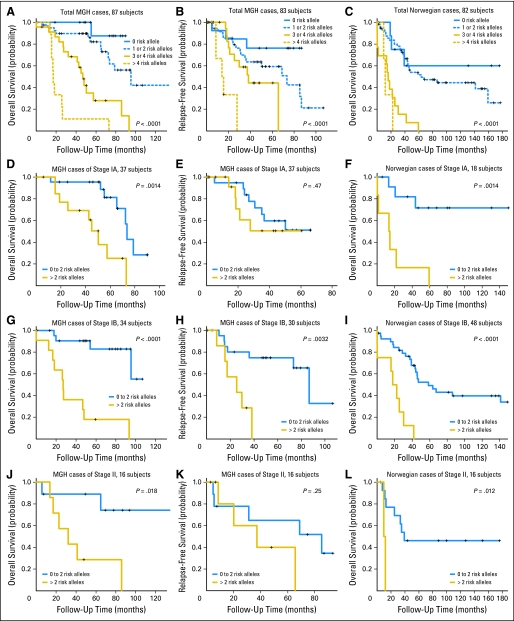
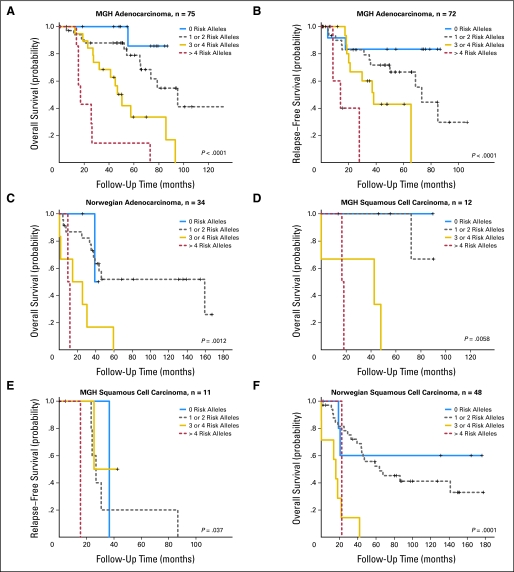
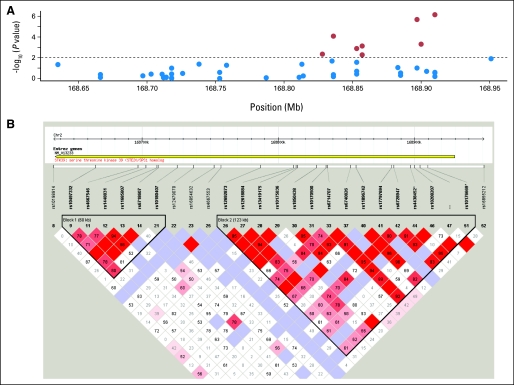
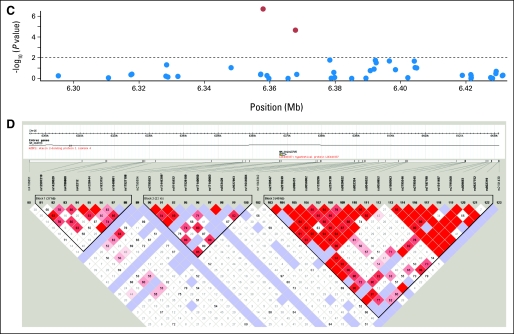
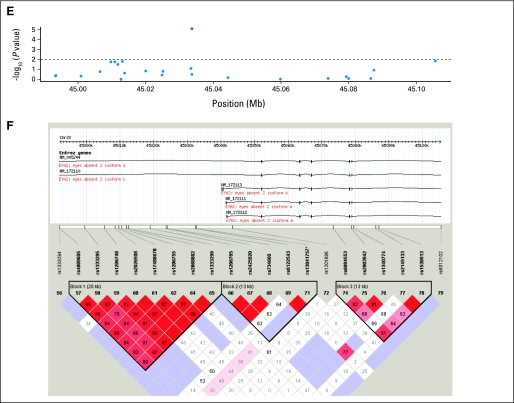
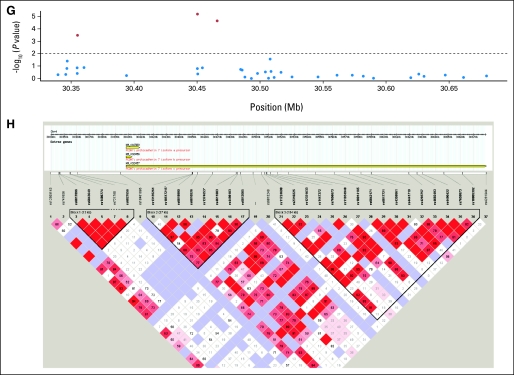
Results: Copy number gains in chromosomes 3q, 5p, and 8q were observed in both MGH and Norwegian cohorts. The top 50 SNPs associated with overall survival in the MGH cohort (P < or = 2.5 x 10(-4)) were selected and examined using the Norwegian cohort. Five of the top 50 SNPs were validated in the Norwegian cohort with false discovery rate lower than 0.05 (P < .016) and all five were located in known genes: STK39, PCDH7, A2BP1, and EYA2. The numbers of risk alleles of the five SNPs showed a cumulative effect on overall survival (P(trend) = 3.80 x 10(-12) and 2.48 x 10(-7) for MGH and Norwegian cohorts, respectively).

Conclusion: Five SNPs were identified that may be prognostic of overall survival in early-stage NSCLC.


Conflict of interest statement

Authors' disclosures of potential conflicts of interest and author contributions are found at the end of this article.

Figures

Fig 1.
Fig 1.
(A) Prevalence (%) and its (B) false discovery rate (q values) of patients with copy number ≥ 2.7 (red) and ≤ 1.3 (blue) in two cohorts, respectively. The x-axis represents the positions in genome/chromosomes, and the y-axis represents the prevalence and -log10 (q values).
Fig 2.
Fig 2.
Kaplan-Meier survival estimates of overall survival among the Massachusetts General Hospital (MGH) and Norwegian cohorts and relapse-free survival among the MGH cohort according to the numbers of risk alleles of the five single nucleotide polymorphisms (rs10176669, rs4438452, rs12446308, rs13041757, and rs10517215) in (A-C) total, (D-F) stage IA, (G-I) stage IB, and (J-L) stage II subjects.
Fig A1.
Fig A1.
Kaplan-Meier survival estimates of overall survival among the Massachusetts General Hospital and Norwegian cohorts and relapse-free survival among the MGH cohort according to the numbers of risk alleles of the five single nucleotide polymorphisms (rs10176669, rs4438452, rs12446308, rs13041757, and rs10517215) in (A-C) adenocarcinoma and (D-F) squamous cell carcinoma.
Fig A2.
Fig A2.
(A, B) Linkage disequilibrium structure of STK39 locating at 2q24.3. (C) The P values of the association of single nucleotide polymorphisms (SNPs) of A2BP1 around rs12446308 (16p13.3) with the overall survival and (D) the corresponding linkage disequilibrium (LD) structure. (E) The P values and the (F) LD plot of EYA2 around rs13041757 (20q13.1). (G, H) SNPs of PCDH7 around rs10517215 and rs1374653 (4p15). (A, C, E, G) The red points represent P < .01, whereas blue points represent P ≥ .01. (B, D, F, H) Boxe are shaded according to the standardized disequilibrium coefficient and the numbers in the boxes represent the disequilibrium coefficient, D', where the empty boxes mean the D' = 1.
Fig A2.
Fig A2.
(A, B) Linkage disequilibrium structure of STK39 locating at 2q24.3. (C) The P values of the association of single nucleotide polymorphisms (SNPs) of A2BP1 around rs12446308 (16p13.3) with the overall survival and (D) the corresponding linkage disequilibrium (LD) structure. (E) The P values and the (F) LD plot of EYA2 around rs13041757 (20q13.1). (G, H) SNPs of PCDH7 around rs10517215 and rs1374653 (4p15). (A, C, E, G) The red points represent P < .01, whereas blue points represent P ≥ .01. (B, D, F, H) Boxe are shaded according to the standardized disequilibrium coefficient and the numbers in the boxes represent the disequilibrium coefficient, D', where the empty boxes mean the D' = 1.

References

    1. Jemal A, Siegel R, Ward E, et al. Cancer statistics, 2007. CA Cancer J Clin. 2007;57:43–66. - PubMed
    1. Govindan R, Page N, Morgensztern D, et al. Changing epidemiology of small-cell lung cancer in the United States over the last 30 years: Analysis of the surveillance, epidemiologic, and end results database. J Clin Oncol. 2006;24:4539–4544. - PubMed
    1. Hoffman PC, Mauer AM, Vokes EE. Lung cancer. Lancet. 2000;355:479–485. - PubMed
    1. Hung RJ, McKay JD, Gaborieau V, et al. A susceptibility locus for lung cancer maps to nicotinic acetylcholine receptor subunit genes on 15q25. Nature. 2008;452:633–637. - PubMed
    1. Amos CI, Wu X, Broderick P, et al. Genome-wide association scan of tag SNPs identifies a susceptibility locus for lung cancer at 15q25.1. Nat Genet. 2008;40:616–622. - PMC - PubMed

Publication types

MeSH terms