. 2009 May 15;182(10):6587-99.
doi: 10.4049/jimmunol.0900317.

Adenovirus vector-induced immune responses in nonhuman primates: responses to prime boost regimens

Affiliations

Adenovirus vector-induced immune responses in nonhuman primates: responses to prime boost regimens

Nia Tatsis et al. J Immunol. .

Erratum in

  • J Immunol. 2009 Dec 1;183(11):7611. Haut, Larissa H [added]

Abstract

In the phase IIb STEP trial an HIV-1 vaccine based on adenovirus (Ad) vectors of the human serotype 5 (AdHu5) not only failed to induce protection but also increased susceptibility to HIV-1 infection in individuals with preexisting neutralizing Abs against AdHu5. The mechanisms underlying the increased HIV-1 acquisition rates have not yet been elucidated. Furthermore, it remains unclear if the lack of the vaccine's efficacy reflects a failure of the concept of T cell-mediated protection against HIV-1 or a product failure of the vaccine. Here, we compared two vaccine regimens based on sequential use of AdHu5 vectors or two different chimpanzee-derived Ad vectors in rhesus macaques that were AdHu5 seropositive or seronegative at the onset of vaccination. Our results show that heterologous booster immunizations with the chimpanzee-derived Ad vectors induced higher T and B cell responses than did repeated immunizations with the AdHu5 vector, especially in AdHu5-preexposed macaques.


Figures
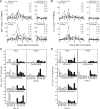
Figure 1
Figure 1. ELISpot for IFN-γ and IL-2 response in NHP
Animals were bled at 2 or 4 week intervals, and PBMCs were isolated and stimulated with gag peptide pools for IFN-γ (A) and IL-2 (B) ELISpot analyses. Lymphocytes were stimulated in 3 replicate wells, and spots in control wells were subtracted from experimental wells before plotting. Data from individual animals are plotted, and arrows below the x-axis denote the time of vaccination. Peak frequencies of IFN-γ (C) and IL-2 (D) ELISpots observed after each vaccination are also plotted for individual animals. White bars represent animals that had been pre-exposed to AdHu5, and black bars represent animals that had not been pre-exposed to AdHu5.
Figure 2
Figure 2. ICS for IFN-γ and IL-2 in CD4+ and CD8+ T cells from NHP
The same NHP samples shown in Figure 1 were tested by ICS for expression of CD3 and CD8 and for production of IFN-γ and IL-2. The symbols for individual animals are the same as in Figure 1. (A) shows percentages of CD8+CD3+ cells positive for IFN-g/ all CD8+ CD3+ cells; (B) shows percentages of CD8+CD3+ cells positive for IL-2 / all CD8+ CD3+ cells; (C) shows percentages of CD8CD3+ cells positive for IFN-g/ all CD8 CD3+ cells; (D) shows percentages of CD8CD3+ cells positive for IL-2 / all CD8 CD3+ cells. The graphs show the sum of responses to the different peptide pools, background responses (responses without peptides) and responses of control animals (both of which were < 0.1%) were subtracted.
Figure 3
Figure 3. Neutralizing antibody responses to Ad vectors
Plasma samples were tested at the indicated time points for neutralizing antibodies to the Ad vectors. The symbols for individual animals are identical to those shown in Figure 1. (A-C) show titers in plasma of animals immunized with the AdC vectors. (D) shows titers in plasma of animals immunized with the AdHu5 vector. (A) shows titers to AdC6; (B and D) show titers to AdHu5, (C) shows titers to AdC7. There was no statistical difference (two-tailed t-test) between anti AdHu5 titers prior to vaccination in the pre-exposed NHPs that were then vaccinated with AdC or AdHu5 vectors (p=0.19). There was a significant difference after the first vaccine dose between pre-exposed and non pre-exposed AdHu5 vaccinated animals (p=0.03).
Figure 4
Figure 4. Gag-specific antibody response
Plasma samples were tested at the indicated time points for binding antibodies to gag. Samples were tested in duplicates; standard deviations (not shown) were below 10% of the mean. The first booster immunization caused a significant increase in titers in the AdC groups (p=0.001, one-tailed t-test), the 2nd and 3rd booster immunizations did not cause further significant increases. In the AdHu5 groups the 1st booster immunization did not cause a significant increase of titers in pre-exposed (p=0.07, note that titers decreased) or the non pre-exposed (p=0.13) animals. The differences in titers between the pre-exposed and non-pre-exposed AdC groups were statistically not significant at any of the time points. The differences in titers between pre-exposed and non pre-exposed AdHu5 vaccinated animals were statistically significant at both time points (p=0.02 and 0.001). The differences between titers of pre-exposed or non pre-exposed animals that received AdC or AdHu5 vectors were not significantly different after the first immunization (p=0.08 for pre-exposed animals and 0.39 for non pre-exposed animals) but reached significance after the 2nd immunization (p=0.0051 for pre-exposed animals, p=0.036 for non pre-exposed animals.
Figure 5
Figure 5. ELISpot response in tissues
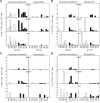
Between 2−3 months after the final immunization, all animals were euthanized and lymphocytes were isolated from the blood and tissues including the spleen and liver, shown here. Lymphocytes were stimulated with gag peptide pools for IFN-γ (A) and IL-2 (B) ELISpot analyses. Lymphocytes were stimulated in 3 replicate wells, and spots in control wells were subtracted from experimental wells before plotting. The vaccine regimen of each group of animals is noted at the top of each column. Data from the tissues of individual animals are plotted. White bars represent animals that had been pre-exposed to AdHu5, and black bars represent animals that had not been pre-exposed to AdHu5.
Figure 6
Figure 6. ICS response in tissues
Lymphocytes isolated from blood, spleens and liver were tested by ICS for expression of CD3 and CD8 and for production of IFN-γ and IL-2. (A) shows percentages of CD8+CD3+ cells positive for IFN-γ / all CD8+ CD3+ cells; (B) shows percentages of CD8+CD3+ cells positive for IL-2 / all CD8+ CD3+ cells; (C) shows percentages of CD8CD3+ cells positive for IFN-γ / all CD8CD3+ cells; (D) shows percentages of CD8CD3+ cells positive for IL-2 / all CD8CD3+ cells. The graphs show the sum of responses to the different pools, background responses (responses without peptides) and responses of control animals (both of which were < 0.1%) were subtracted.
Figure 7
Figure 7. Cytokine expression profile of gag-specific CD8+ T cells
(A) PBMC isolated from immunized NHPs at an early (week 6) and late (week 10) time point after each immunization were stimulated in vitro with gag peptide pools and production of IFN-γ, IL-2 and TNF-a were analyzed by ICS. Cytokine co-expression profiles (pie charts) were determined in memory (CD95+CD28+) CD8+ T cells for NHPs #3 (1st row), #9 (2nd row) and #11 (3rd row). IFN-γ+/IL-2+/TNF-a+, light blue; IFN-γ+/IL-2+/TNF-a, red; IFN-γ+/IL-2/TNF-a+, yellow; IFN-γ+/IL-2/TNF-a, green; IFN-γ/IL-2+/TNF-a+, dark blue; IFN-γ/IL-2+/TNF-a, orange; and IFN-γ/IL-2/TNF-a+, brown. Percentage of cytokine-producing CD8+ T cells over total CD8+ T cells (line graphs) were determined for effector (CD95+CD28, black squares) and memory (CD95+CD28+, black triangles), CD8+ T cells. Lymphocytes isolated from spleen (B and C) and liver (D and E) of immunized NHPs were stimulated in vitro with gag peptide pools and production of IFN-γ, IL-2 and TNF-a were analyzed by ICS. (B) and (D), cytokine co-expression profiles for effector (1st row) and memory (2nd row) CD8+ T cells were determined for NHP #3, 7, 9, 11. IFN-γ+/IL-2+/TNF-α+, light blue; IFN-γ+/IL-2+/TNF-α, red; IFN-γ+/IL-2/TNF-α+, yellow; IFN-γ+/IL-2/TNF-α, green; IFN-γ/IL-2+/TNF-α+, dark blue; IFN-γ/IL-2+/TNFα, orange; and IFN-γ/IL-2/TNF-α+, brown. (C) and (E), Percentage of cytokine-producing CD8+ T cells over total CD8+ T cells were determined for effector (black bars) and memory (dotted grey bars) from NHPs #3, 7, 9 and 11.
Figure 8
Figure 8. Cytokine expression profile of gag-specific CD4+ T cells
The same NHP samples shown in Figure 7 were tested by ICS for CD3+ and CD8 (CD4+). The symbols and colors are the same as in Figure 7. (A) Cytokine co-expression profiles (pie charts) were determined in memory (CD95+CD28+) CD4+ T cells for NHPs #3 (1st row), #9 (2nd row) and #11 (3rd row). Percentage of cytokine-producing CD4+ T cells over total CD4+ T cells (line graphs) were determined for effector (CD95+CD28, black squares) and memory (CD95+CD28+, black triangles) CD4+ T cells. Lymphocytes isolated from spleen (B and C) and liver (D and E) were stimulated in vitro with gag peptide pools and production of IFN-γ, IL-2 and TNF-a were analyzed by ICS. (B) and (D), Cytokine co-expression profiles for effector (1st row), and memory CD4+ T cells (2nd row) were determined for NHPs #3, 7, 9, 11. Cytokine profile production colors and symbols are the same as shown in Figure 7. (C) and (E), percentage of cytokine-producing CD4+ T cells over total CD4+ T cells were determined for effector (black bars), snd memory (grey dotted bars) CD4+ (i.e., CD8CD3+ cells) T cells from NHPs #3, 7, 9 and 11.
Figure 9
Figure 9. Levels of cytokine production by gag-specific memory T cells producing three cytokines were higher than those producing only one cytokine
Lymphocytes isolated from liver, spleen and blood of immunized NHPs were stimulated in vitro with HIV-1 gag peptide pool. The mean fluorescence intensity (MFI) of IFN-γ (first row), IL-2 (second row) and TNF-α (third row) produced by CD28+CD95+CD8+ (A) and CD28+CD95+CD4+ (B) T cells were analyzed by ICS. Triple+ (black circles) and double+ (gray squares) cytokine producers were compared to single+ (white triangles) cytokine producers. *, triple+ cytokine producers were statistically different than single+ cytokine producers (p<0.05). When MFI axes were segmented The dotted grey line shows where the Y axis was segmented.
Figure 10
Figure 10. Presence of Ad vector sequences in CD95 expressing CD8+ T cells
(A) IFN-γ producing CD8+ PBMCs (red) from NHP immunized with AdC were plotted with total CD8+ PBMCs (black/gray) for expression of CD95. CD8+ PBMCs were sorted into CD95low, CD95intermediate (int) and CD95high cells and (B) presence of specific AdC6 (open bars) and AdC7 (black bars) vector genome sequences, i.e. hexon, were determined by real-time PCR.

References

    1. Robinson HL. HIV/AIDS vaccines: 2007. Clin. Pharmacol. Ther. 2007;82:686–93. - PubMed
    1. Steinbrook R. One Step Forward, Two Steps Back -- Will There Ever Be an AIDS Vaccine? N. Engl. J. Med. 2007;357:2653–2655. - PubMed
    1. Hanke T. STEP trial and HIV-1 vaccines inducing T-cell responses. Expert Rev. Vaccines. 2008;7:303–9. - PubMed
    1. Watkins DI, Burton DR, Kallas EG, Moore JP, Koff WC. Nonhuman primate models and the failure of the Merck HIV-1 vaccine in humans. Nat. Med. 2008;14:617–21. - PMC - PubMed
    1. Moore JP, Klasse PJ, Dolan MJ, Ahuja SK. AIDS/HIV. A STEP into darkness or light? Science. 2008;320:753–5. - PubMed

Publication types

MeSH terms