. 2009;4(5):e5325.
doi: 10.1371/journal.pone.0005325. Epub 2009 May 5.

Determination of cellular lipids bound to human CD1d molecules

Affiliations

Determination of cellular lipids bound to human CD1d molecules

Daryl Cox et al. PLoS One. 2009.

Abstract

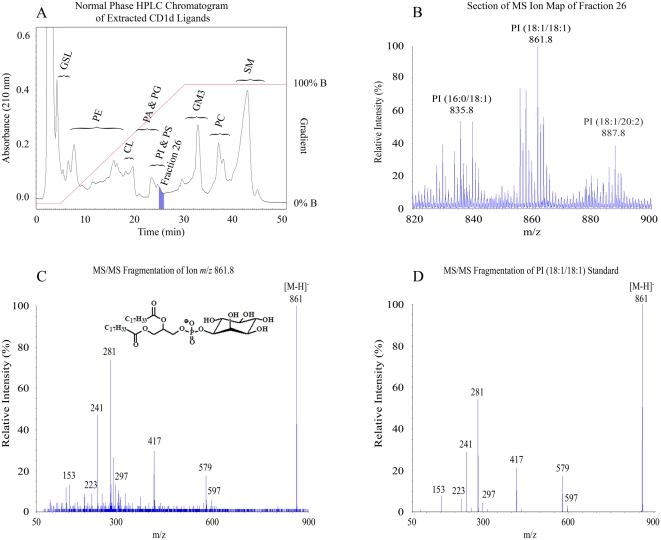
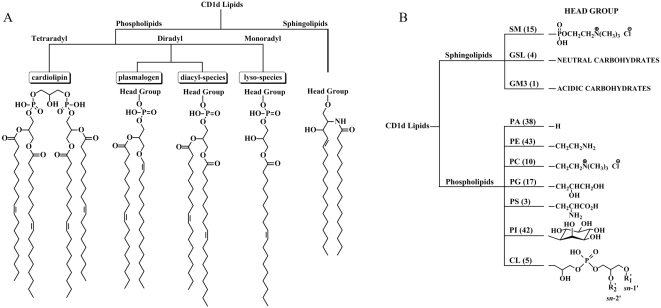
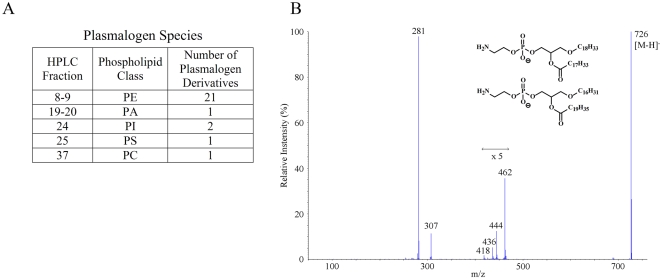
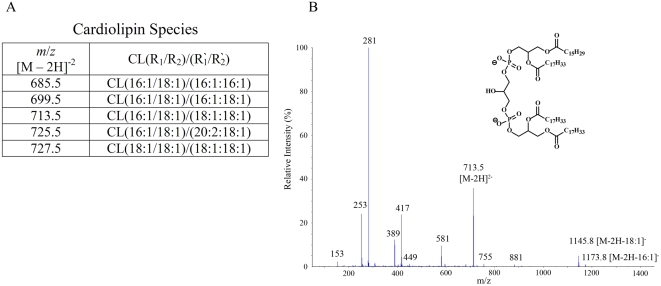
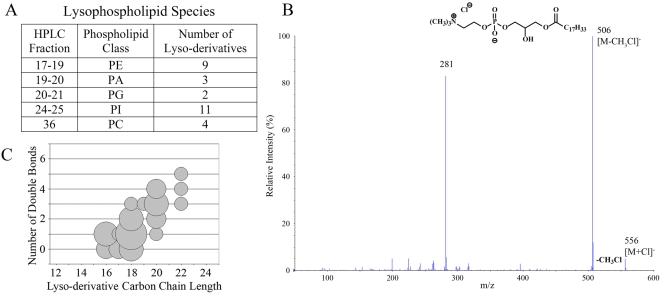
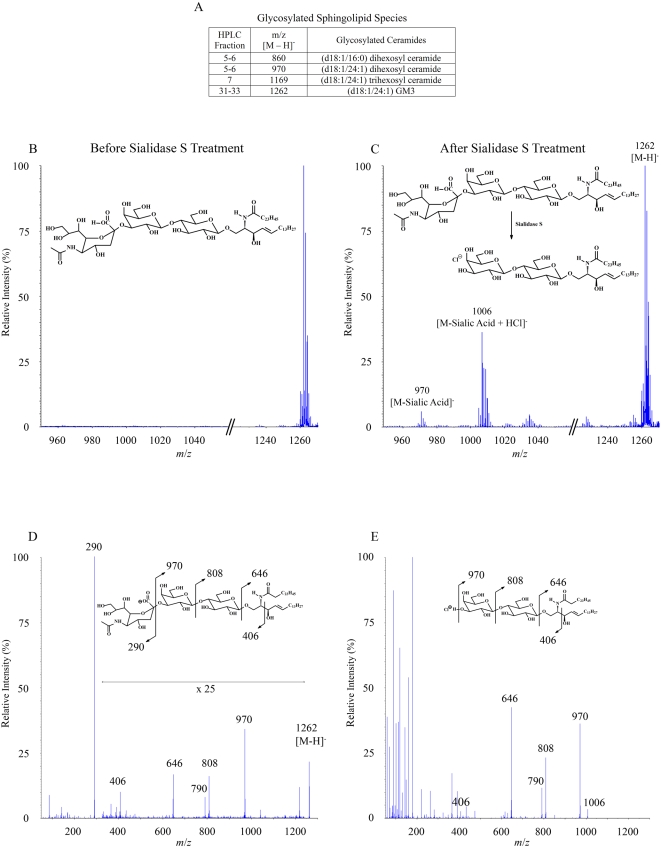
CD1 molecules are glycoproteins that present lipid antigens at the cell surface for immunological recognition by specialized populations of T lymphocytes. Prior experimental data suggest a wide variety of lipid species can bind to CD1 molecules, but little is known about the characteristics of cellular ligands that are selected for presentation. Here we have molecularly characterized lipids bound to the human CD1d isoform. Ligands were eluted from secreted CD1d molecules and separated by normal phase HPLC, then characterized by mass spectroscopy. A total of 177 lipid species were molecularly identified, comprising glycerophospholipids and sphingolipids. The glycerophospholipids included common diacylglycerol species, reduced forms known as plasmalogens, lyso-phospholipids (monoacyl species), and cardiolipins (tetraacyl species). The sphingolipids included sphingomyelins and glycosylated forms, such as the ganglioside GM3. These results demonstrate that human CD1d molecules bind a surprising diversity of lipid structures within the secretory pathway, including compounds that have been reported to play roles in cancer, autoimmune diseases, lipid signaling, and cell death.


Conflict of interest statement

Competing Interests: The authors have declared that no competing interests exist.

Figures

Figure 1
Figure 1. Isolation and characterization of ligands bound to human CD1d molecules.
Secreted CD1d molecules were isolated by affinity chromatography and subject to organic extraction followed normal phase chromatographic separation (HPLC), and mass spectrometry (MS). A) HPLC chromatogram of extracted material. The general categories of lipids found along the profile are indicated using the following abbreviations: GSL, glycosphingolipid; PE, phosphatidylethanolamine; CL, cardiolipin; PA, phosphatidic acid; PG, phosphatidylglycerol; PI, phosphatidylinositol; PS, phosphatidylserine; GM3, ganglioside GM3; PC, phosphatidylcholine; SM, sphingomeylin. B) A section of MS ion map of fraction 26 in the negative ion mode. Ions were manually selected for MS/MS fragmentation. Within this section of the ion map three lipids were characterized, as shown by the labels above the corresponding peaks. C) MS/MS fragmentation pattern of one of these lipids, ion m/z 861. The [M−H] of ion 861 provides ions m/z 597 [M−H−C16H31CH = C = O] (the loss of the 18∶1 ketene), m/z 579 [M−H−C17H33CO2H] (the loss of the 18∶1 carboxylic acid), m/z 417 [M−H−C16H31CH = C = O−Ins] (the loss of the 18∶1 ketene and inositol), m/z 281 [C17H33CO2], (18∶1 fatty acid), m/z 241 [Ins-PO3−H2O] (dehydrated inositol phosphate). D) MS/MS fragmentation pattern of synthetic PI (18∶1/18∶1).
Figure 2
Figure 2. Overview of the diversity of lipids identified in the CD1d ligand pool
. A total of 177 molecular species were identified. The majority of lipids characterized were phospholipids, but sphingolipid species were also identified. A) Tree diagram showing the categories and structural characteristics of lipids found within the ligand pool. B) Tree diagram showing the diversity of lipid head groups. Lipid classes are abbreviated as described in the legend for figure 1A. Numbers in parentheses represents the number of lipid species (i.e. radyl group carbon chain variations) characterized in that subcategory.
Figure 3
Figure 3. Structural characteristics of radyl group carbon chains.
Analysis of the length and degree of unsaturation of the carbon chains of diradyl lipid species identified within the ligand pool. The sizes of the circles are proportional to the number of lipid species at each set of coordinates. A total of 149 lipid species were included in the analysis. A) Analysis of sn-1 carbon chains, comparing the number of double bonds to the length. B) Analysis of sn-2 carbon chains, comparing the number of double bonds to the length. C) Comparison of the lengths of the sn-2 versus sn-1 carbon chains. D) Comparison of the number of double bonds in the sn-2 versus sn-1 carbon chains.
Figure 4
Figure 4. Identification of plasmalogens.
A fraction of the diradyl phospholipid species within the CD1d ligand pool were identified as plasmalogens, as exemplified by the mass spectrometry data shown here. A) Table summarizing the types of plasmalogen phospholipids identified. B) Negative ion MS/MS of two PE ether plasmalogen species (m/z 726.7), from the MS ion map of Fraction 9. Only the carboxylate ion was characterized. Ions m/z 462 and m/z 444 result from the loss of the 18∶1 ketene and the 18∶1 carboxylic acid respectively; ions m/z 436 and m/z 418 result from the loss of the 20∶2 ketene and the 20∶2 carboxylic acid respectively. The molecular formulas for the resulting ether moieties was deduced from the mass of the [M−H−ketene] and [M−H−RCO2H] ions. The structures of the ether moieties were not unequivocally determined. They could be plasmenyl or plasmanyl radyl groups.
Figure 5
Figure 5. Identification of cardiolipins.
Cardiolipins, which are tetraradyl dimers of phosphatidylglycerol, were present in the CD1d ligand pool. A) Table summarizing the cardiolipin species identified. B) Negative ion MS/MS of ion m/z 713.5 from the MS ion map of Fraction 18, containing cardiolipin (18∶1/16∶1)/(18∶1/18∶1). The map shows m/z 713.5 [M−2H]2−, m/z 1173.8 [M−2H−C15H29CO2], m/z 1145.8 [M−2H−C17H33CO2], m/z 581 [(713.5×2−C16H31CH = C = O)/2]2−, m/z 417 (loss of FA from sn-2 and sn-1 positions of 18∶1/18∶1 PA structure and the sn-1 position of 18∶1/16∶1 PA structure), m/z 389 (loss of FA from sn-2 position of 18∶1/16∶1 PA structure).
Figure 6
Figure 6. Identification of lysophospholipids.
A variety of lyso-phospholipids (i.e. monoradyl species) were found in the CD1d ligand pool. A) Table summarizing the types of lyso-phospholipids identified. B) Negative ion MS/MS of ion m/z 556.5 from ion map of Fraction 36, containing the chloride ion adduct of C18∶1/C0∶0 PC (lyso-PC or LPC). Ion m/z 556 [M+Cl], gives rise to m/z 506 from the neutral loss of chloromethane ([M+Cl]−CH3Cl). The fatty acid 18∶1 is indicated by the ion m/z 281. C) Analysis of the carbon chains of the identified lyso-phospholipid species for the number of double bonds compared to chain length.
Figure 7
Figure 7. Identification of glycosylated sphingolipids.
Four glycosylated sphingolipid species were identified in the CD1d ligand pool. The most abundant species was identified as the ganglioside GM3 (see Figure 1A). Additionally, three glycosylated ceramides were found. A) Table summarizing the glycosylated lipid ligands identified. B) The most abundant species, fraction 33 of the normal phase HPLC separation, was subject to further characterization by enzymatic digestion and mass spectrometry. Shown is the partial negative ion MS map of fraction 33. C) Partial negative ion MS map of fraction 33 after Sialidase S treatment. Note the formation of ions resulting from the cleavage of sialic acid from the parent compound. D) MS/MS fragmentation of ion m/z 1262 [M−H] from panel A. The fragmentation pattern shows the loss of sialic acid, m/z 970 [M−sialic acid], m/z 808 [M−sialic acid−hexose], m/z 790 [M−sialic acid−hexose−H2O], m/z 646 [M−sialic acid−hexose−hexose], m/z 406 [C26H48NO2] (N-acyl chain+carbons 1 and 2 of LCB). E) Negative ion MS/MS fragmentation of ion m/z 1006 [M+Cl] from panel C. The fragmentation pattern shows that after enzymatic cleavage of the sialic acid residue, the remaining two sugar residues are lost in an identical fashion to that of the GM3 species in Panel D.

References

    1. Brigl M, Brenner MB. CD1: Antigen Presentation and T Cell Function. Annu Rev Immunol. 2004;22:817–890. - PubMed
    1. Bendelac A, Savage PB, Teyton L. The biology of NKT cells. Annu Rev Immunol. 2007;25:297–336. - PubMed
    1. Zajonc DM, Cantu C, 3rd, Mattner J, Zhou D, Savage PB, et al. Structure and function of a potent agonist for the semi-invariant natural killer T cell receptor. Nat Immunol. 2005;6:810–818. - PMC - PubMed
    1. Zajonc DM, Maricic I, Wu D, Halder R, Roy K, et al. Structural basis for CD1d presentation of a sulfatide derived from myelin and its implications for autoimmunity. J Exp Med. 2005;202:1517–1526. - PMC - PubMed
    1. Zajonc DM, Savage PB, Bendelac A, Wilson IA, Teyton L. Crystal structures of mouse CD1d-iGb3 complex and its cognate Valpha14 T cell receptor suggest a model for dual recognition of foreign and self glycolipids. J Mol Biol. 2008;377:1104–1116. - PMC - PubMed

Publication types