. 2009;4(5):e5393.
doi: 10.1371/journal.pone.0005393. Epub 2009 May 5.

Transcriptional analysis of fracture healing and the induction of embryonic stem cell-related genes

Affiliations

Transcriptional analysis of fracture healing and the induction of embryonic stem cell-related genes

Manish Bais et al. PLoS One. 2009.

Abstract

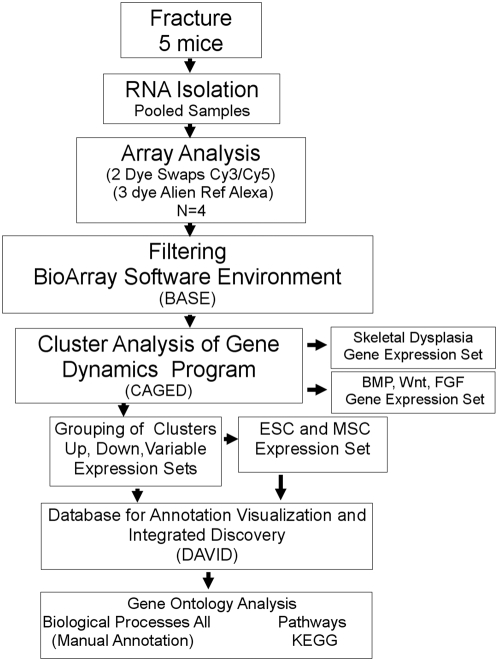
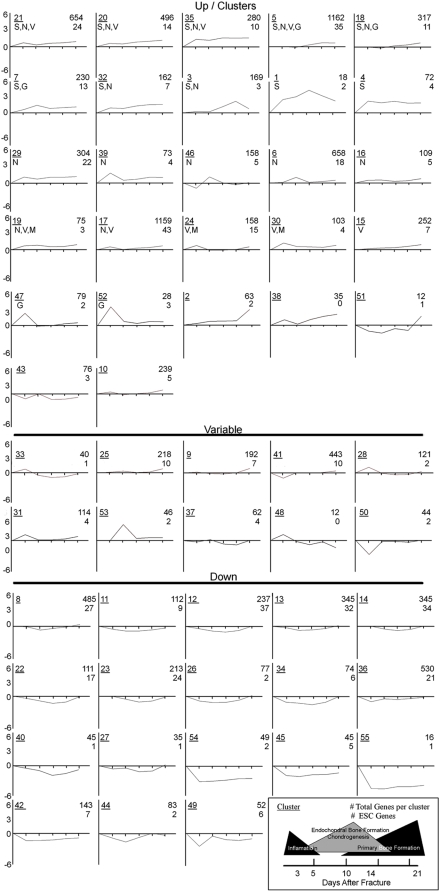
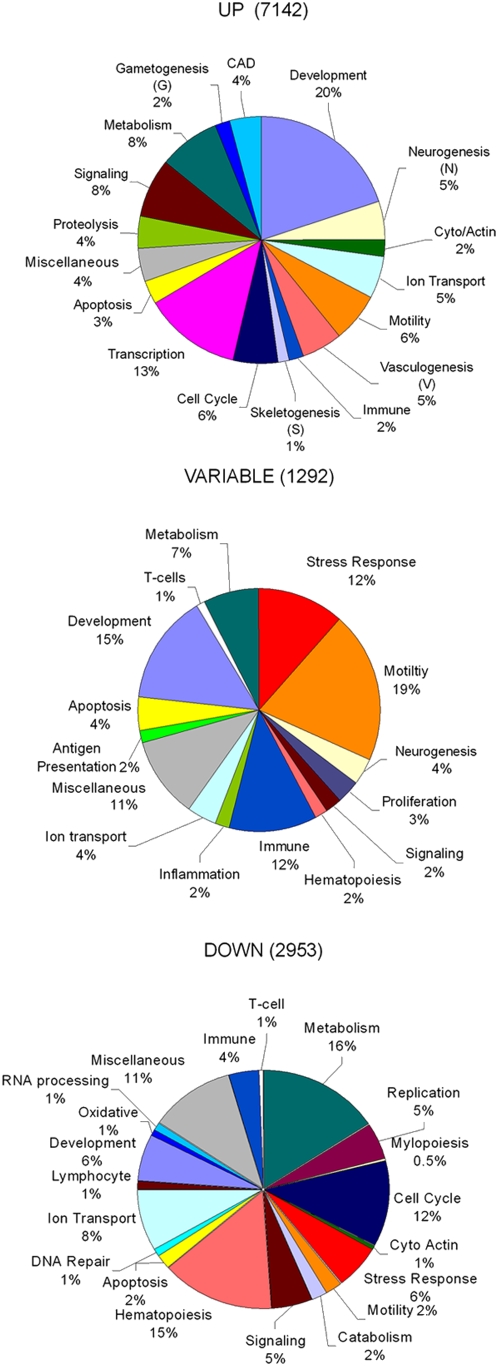
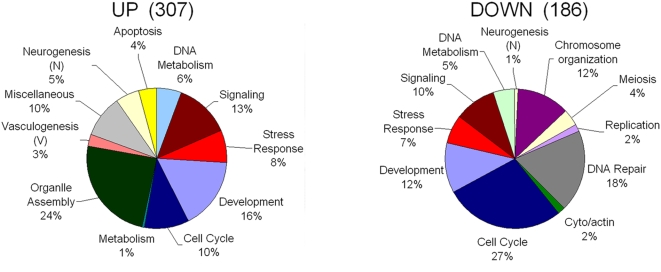
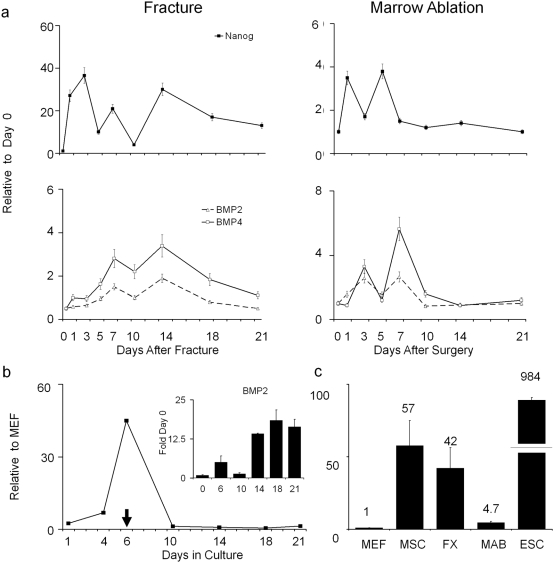
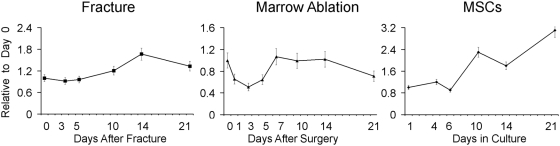
Fractures are among the most common human traumas. Fracture healing represents a unique temporarily definable post-natal process in which to study the complex interactions of multiple molecular events that regulate endochondral skeletal tissue formation. Because of the regenerative nature of fracture healing, it is hypothesized that large numbers of post-natal stem cells are recruited and contribute to formation of the multiple cell lineages that contribute to this process. Bayesian modeling was used to generate the temporal profiles of the transcriptome during fracture healing. The temporal relationships between ontologies that are associated with various biologic, metabolic, and regulatory pathways were identified and related to developmental processes associated with skeletogenesis, vasculogenesis, and neurogenesis. The complement of all the expressed BMPs, Wnts, FGFs, and their receptors were related to the subsets of transcription factors that were concurrently expressed during fracture healing. We further defined during fracture healing the temporal patterns of expression for 174 of the 193 genes known to be associated with human genetic skeletal disorders. In order to identify the common regulatory features that might be present in stem cells that are recruited during fracture healing to other types of stem cells, we queried the transcriptome of fracture healing against that seen in embryonic stem cells (ESCs) and mesenchymal stem cells (MSCs). Approximately 300 known genes that are preferentially expressed in ESCs and approximately 350 of the known genes that are preferentially expressed in MSCs showed induction during fracture healing. Nanog, one of the central epigenetic regulators associated with ESC stem cell maintenance, was shown to be associated in multiple forms or bone repair as well as MSC differentiation. In summary, these data present the first temporal analysis of the transcriptome of an endochondral bone formation process that takes place during fracture healing. They show that neurogenesis as well as vasculogenesis are predominant components of skeletal tissue formation and suggest common pathways are shared between post-natal stem cells and those seen in ESCs.


Conflict of interest statement

Competing Interests: The authors have declared that no competing interests exist.

Figures

Figure 1
Figure 1. Flow chart of the logistics of the array analysis.
Each of the major technical steps of the analysis is boxed. Arrows show the linear progression of the individual steps taken during the analysis. Programs used for each stage of the analysis are indicated in the parenthesis.
Figure 2
Figure 2. Temporal profiles of gene expression across fracture healing.
Expression profiles of the temporal clusters produced by the Baysian modeling are presented. The three major groups of gene expression patterns (UP, Down and Variable) based on their temporal patterns of expression are presented. Biological ontologies associated with the development of specific tissue types (N = neurogenesis, V = vasculogenesis, S = Skeletogenesis, G = Gametogenesis) are indicated in the figure. All clusters in the variable group are specifically associated with T cell or B cell function or development. The underlined number is the cluster upper number is the total expressed genes in a cluster and lower number is the number of genes associated with ESCs. A diagrammatic presentation of the general biological stages of murine fracture healing, duration and relative scale of each stage are denoted in the figure in the lower right corner of the figure.
Figure 3
Figure 3. Distribution of biological functions associated with three major temporal grouping of gene expression.
Pie Graph Distribution of biological functions was based on analysis of the three major groupings of the temporal clusters as indicated in Figure 1 using Database for Annotation, Visualization and Integrated Discovery (DAVID). Only those biological functional ontologies with p<.05 were considered with over lapping functions consolidated into single categories as indicated in Table S1. The total number of genes within each of the major groupings is indicated in the figure and percentage distributions of the grouping were calculated as descried in the materials and methods. A uniform color coding between the pie graphs for the biological groupings was used for comparisons between the groups.
Figure 4
Figure 4. Distribution of biological functions associated with ESC genes identified as expressed during fracture repair.
Two major temporal grouping of gene expression (Up or Down) is presented in a pie graph. Distribution of biological functions was based on analysis of the groupings of the temporal clusters as indicated in figure one using. Up and Variable groupings were consolidated together for analysis using Database for Annotation, Visualization and Integrated Discovery (DAVID). Only those biological functional ontologies with p<.05 were considered and those with over lapping functions were consolidated into single categories as indicated in Table S2. The total number of genes within each of the major groupings is indicated in the figure and percentage distributions of the grouping were calculated as descried in the materials and methods. A uniform color coding between the pie graphs for the biological groupings was used for comparisons between the groups.
Figure 5
Figure 5. Comparison of steady-state Nanog mRNA expression relative to BMP2 and BMP4 mRNA expression levels over the time course of bone development in different models post-natal skeletal tissue formation.
(A) Two in vivo models of injury induced bone formation. Fracture is presented on the left and marrow ablation is presented on the right. Time after fracture or surgical marrow ablation is indicated in the figure. Nanog profiles are in the top panel and BMP profiles are in the bottom panels. RNA measurements are presented as a relative fold of expression to day 0. Error bars  =  SD of three replicate measurements. (B) Relative mRNA expression of Nanog across the 21 time course of MSC differentiation. Arrow indicates time point at which media was switched to differentiation promoting media containing 10−8 M Dexamethasome, 5mM β-GPO4, and ascorbate. Inset shows the comparisons of BMP2 levels across the same time of MSC differentiation. Levels of Nanog expression were made relative to murine embryonic fibroblasts while BMP levels were made in comparison to Day 0. c) Comparison of Nanog expression levels between various in vivo models of injury induced of post natal bone formation and in vitro models of MSC differentiation. All levels of expression were made at the time point at which maximal Nanog expression was observed. All levels are expressed relative to murine embryonic fibroblasts. Fold difference to MEFs are indicted by the numbers over each bar. Groups are MEF =  murine embryonic fibroblasts: Far left shows the levels of ESCs for comparison. Differences in ESC scale are denoted by broken bar. Mean fold levels different from MEFs are numerically denoted above each bar in the figure. Marrow Stromal Cells  = MSCs. Fracture callus tissues at 14 days post fracture  =  FX: Marrow ablation tissues at 5 days post surgery =  MAB. Error bars  =  SD of three replicate measurements.
Figure 6
Figure 6. Comparison of steady-state mRNA expression levels of Methyl-CpG binding domain protein 2 over the time course of bone development in different models post-natal skeletal tissue formation.
Two in vivo models of injury induced bone formation, Fracture (left panel) and marrow ablation (middle panel) are compared to the 21 time course of MSC differentiation (right panel). Time after fracture, surgical marrow ablation, or time after plating in culture are indicated in the figure RNA measurements are presented as a relative fold of expression to day 0. Error bars  =  SD of three replicate measurements.

References

    1. US Department of Health and Human Services. 2004. Bone Health and Osteoporosis: A Report of the Surgeon General. Rockville: USDHHS/PHS. - PubMed
    1. Phillips AM. Overview of the fracture healing cascade. Injury. 2005;36S:55–57. - PubMed
    1. Nork SE. Chapter 47: Fractures of the shaft of the femur. In: Bucholz RW, Heckman JD, Court-Brown C, editors. Rockwood and Green's Fractures in Adults (6th edition) Lippincott, Williams, and Wilkins; 2006. pp. 1845–1914.
    1. Buckwalter JA, Einhorn TA, Marsh LJ. Bone and Joint Healing. In: Bucholz RW, Heckman JD, editors. Rockwood and Green's Fractures in Adults. Philadelphia: Lippincott, Williams, and Wilkins; 2001. pp. 245–271.
    1. Ferguson C, Alpern E, Miclau T, Helms JA. Does adult fracture repair recapitulate embryonic skeletal formation? Mech Dev. 1999;87:57–66. - PubMed

Publication types