

A cellular automaton framework for infectious disease spread simulation
- PMID: 19415136
- PMCID: PMC2666960
- DOI: 10.2174/1874431100802010070
A cellular automaton framework for infectious disease spread simulation
Abstract
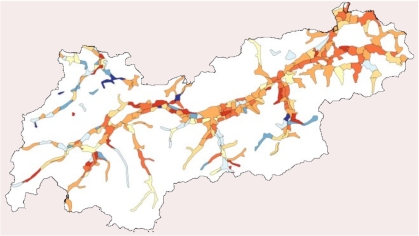
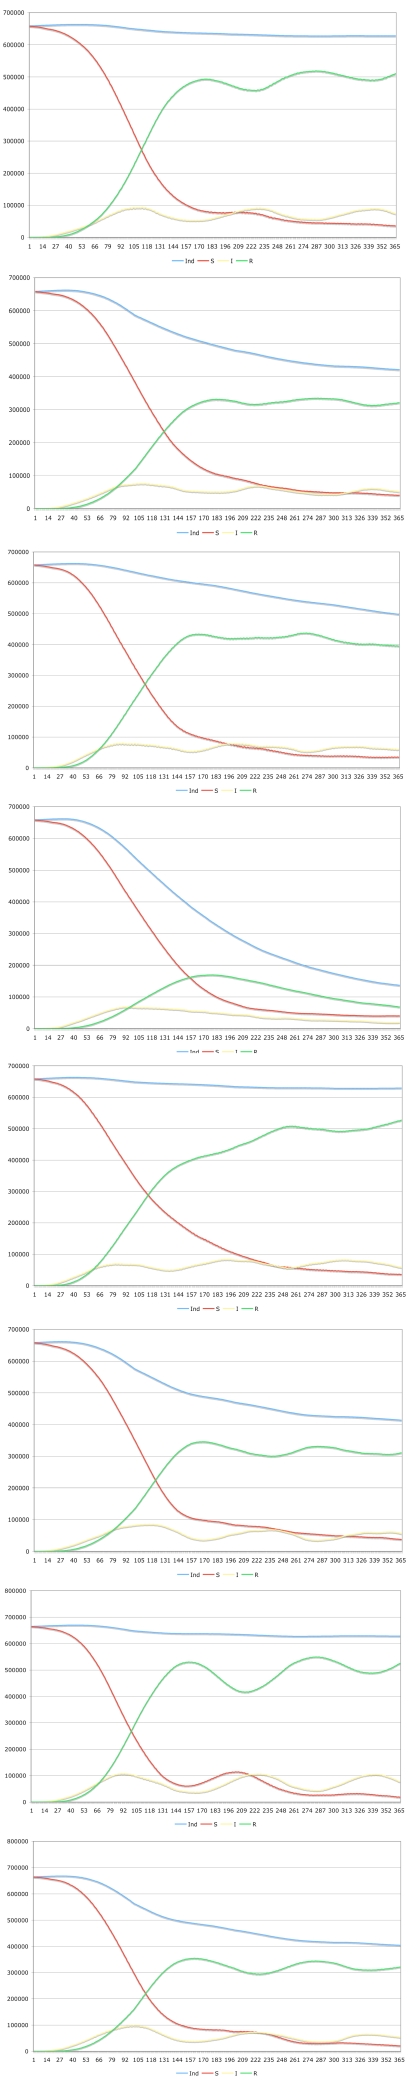
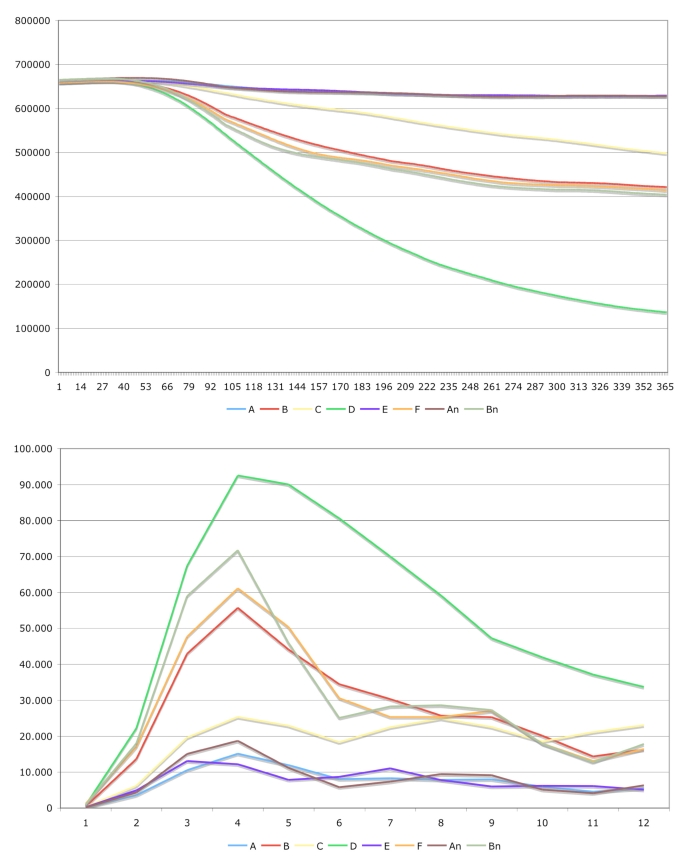
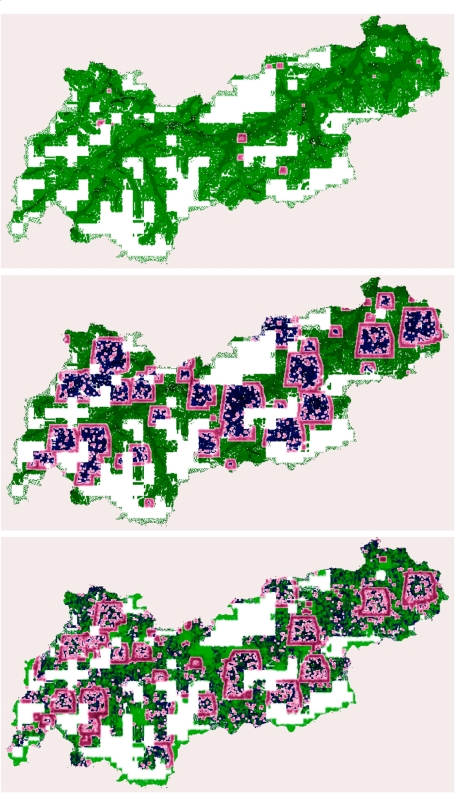
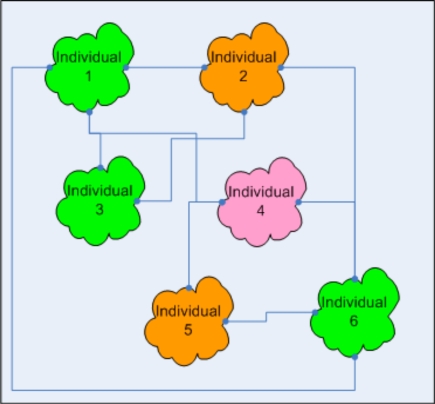
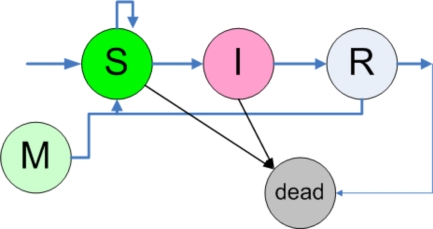
In this paper, a cellular automaton framework for processing the spatiotemporal spread of infectious diseases is presented. The developed environment simulates and visualizes how infectious diseases might spread, and hence provides a powerful instrument for health care organizations to generate disease prevention and contingency plans. In this study, the outbreak of an avian flu like virus was modeled in the state of Tyrol, and various scenarios such as quarantine, effect of different medications on viral spread and changes of social behavior were simulated.The proposed framework is implemented using the programming language Java. The set up of the simulation environment requires specification of the disease parameters and the geographical information using a population density colored map, enriched with demographic data.The results of the numerical simulations and the analysis of the computed parameters will be used to get a deeper understanding of how the disease spreading mechanisms work, and how to protect the population from contracting the disease. Strategies for optimization of medical treatment and vaccination regimens will also be investigated using our cellular automaton framework.In this study, six different scenarios were simulated. It showed that geographical barriers may help to slow down the spread of an infectious disease, however, when an aggressive and deadly communicable disease spreads, only quarantine and controlled medical treatment are able to stop the outbreak, if at all.
Figures
References
-
- World Health Organization (WHO) Available fromhttp://www. who.int.
-
- Xiao X, Shao SH, Chou KC. A probability cellular automaton model for hepatitis b viral infections. Biochem Biophys Res Commun. 2006;342:605–15. - PubMed
-
- Triampo W, Baowan D, Tang I, Nuttavut N, Wong-Ekkabut J, Dougchawee G. A simple deterministic model for the spread of leptospirosisin Thailand. Int J of Biomed. 2007;2:22–26.
-
- Sloot P, Chen F, Boucher C. Cellular automata model of drug therapy for HIV infection. Cellular Automata for Research and Industry (ACRI) 2002. pp. 282–93.
-
- Ormerod C. Cellular automata model of HIV infection on tilings of the plane. Proceedings of the 7th Asia-Pacific Conference on Complex Systems; 2004. Available from: http://www.maths.usyd. edu.au/u/pubs/publist/preprints/2004/ormerod-38.html .
LinkOut - more resources
Full Text Sources