. 2009 Jul 1;107(4):759-68.
doi: 10.1002/jcb.22174.

Regulation and function of proline oxidase under nutrient stress

Affiliations

Regulation and function of proline oxidase under nutrient stress

Jui Pandhare et al. J Cell Biochem. .

Abstract

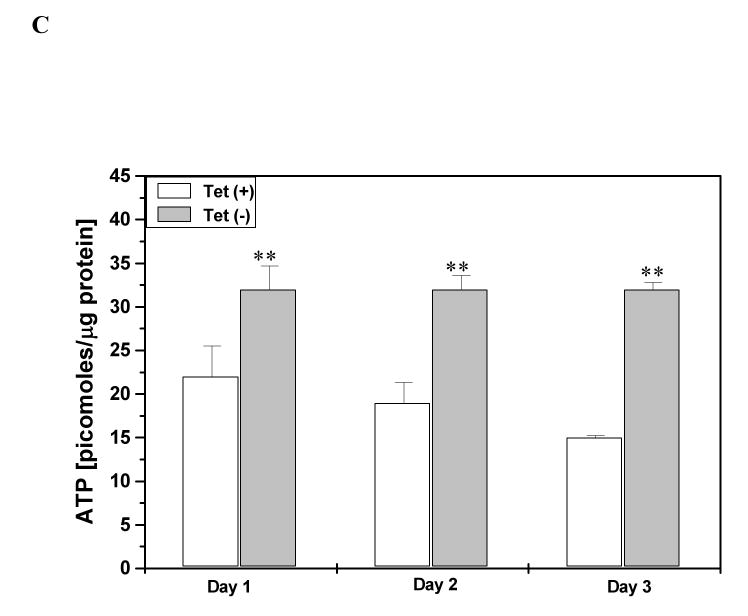
Under conditions of nutrient stress, cells switch to a survival mode catabolizing cellular and tissue constituents for energy. Proline metabolism is especially important in nutrient stress because proline is readily available from the breakdown of extracellular matrix (ECM), and the degradation of proline through the proline cycle initiated by proline oxidase (POX), a mitochondrial inner membrane enzyme, can generate ATP. This degradative pathway generates glutamate and alpha-ketoglutarate, products that can play an anaplerotic role for the TCA cycle. In addition the proline cycle is in a metabolic interlock with the pentose phosphate pathway providing another bioenergetic mechanism. Herein we have investigated the role of proline metabolism in conditions of nutrient stress in the RKO colorectal cancer cell line. The induction of stress either by glucose withdrawal or by treatment with rapamycin, stimulated degradation of proline and increased POX catalytic activity. Under these conditions POX was responsible, at least in part, for maintenance of ATP levels. Activation of AMP-activated protein kinase (AMPK), the cellular energy sensor, by 5-aminoimidazole-4-carboxamide ribonucleoside (AICAR), also markedly upregulated POX and increased POX-dependent ATP levels, further supporting its role during stress. Glucose deprivation increased intracellular proline levels, and expression of POX activated the pentose phosphate pathway. Together, these results suggest that the induction of proline cycle under conditions of nutrient stress may be a mechanism by which cells switch to a catabolic mode for maintaining cellular energy levels.


Figures

Fig. 1
Fig. 1. Schematic Representation of proline metabolism
The first step in the degradation of proline (PRO) is its conversion to pyrroline-5-carboxylate (P5C), by proline oxidase (POX). P5C can be reduced back to proline by P5C-reductase (P5CR) or it can be converted to glutamate by the enzyme, pyrroline-5-carboxylate dehydrogenase (P5CD) and can enter the TCA cycle or alternately it can be converted to ornithine by ornithine aminotransferase (OAT) and can enter the urea cycle.
Fig. 2
Fig. 2. Nutrient stress induced by rapamycin treatment and glucose withdrawal induces POX
(A)(a) RKO cells were treated with rapamycin (10nmol/L) or DMSO in control for various time periods and the POX catalytic activity was measured. Glucose concentration was 5 mM. The results are expressed as mean ± S.E. for three separate experiments. (b) RKO cells were exposed to medium containing rapamycin at various concentrations for 24 hours; the cell lysates were harvested, and the POX catalytic activity was determined. The results are expressed as mean ± S.E. for three separate experiments. **, p < 0.005 is for comparison of rapamycin-treated cells vs untreated cells. (B) RKO cells were exposed for 24 hours to medium with decreasing glucose concentrations from 5mM (control) to 0.01mM and; (a) the levels of endogenous POX protein were determined by Western blotting; the bands of POX were analyzed by densitometry. (b) the POX catalytic activity was measured and (c) RKO cells were treated with medium containing 0.05 mM glucose and collected at various time points. The cell lysates were harvested, and the POX catalytic activity was determined. The results are expressed as mean ± S.E. for three separate experiments. **, p < 0.005 in comparison of glucose-deprived cells vs control cells.
Fig. 3
Fig. 3. Effect of Rapamycin and glucose withdrawal on intracellular ATP levels
RKO cells were exposed to medium with A) decreasing glucose concentrations from 5mM (control) to 0.01mM; B) rapamycin (10nmol/L) or DMSO in control for various time period and C) rapamycin (10nmol/L) in the presence and absence of 10 mM proline/dehydroproline (DHP). The cells were lysed and the intracellular ATP levels were measured using a luciferase based assay. The results are expressed as mean ± S.E. for three separate experiments. Statistical comparisons were as follows: for B, * *, p < 0.005 in comparison of rapamycin-treated versus respective controls; for C, * *, p < 0.005 for rapamycin-treated samples compared to controls without rapamycin; + +, p < 0.005 in comparison of samples treated with dehydroproline (DHP) versus corresponding samples without DHP.
Fig. 4
Fig. 4. The activation of POX under glucose deprived conditions may be mediated by AMPK
A) RKO cells were exposed to medium with decreasing glucose concentrations from 5mM (control) to 0.01mM and the activation of AMPK by phosphorylation at Thr 172 was monitored by western blot analysis. (B) RKO cells were treated with AICAR (0.5 mM) or DMSO in control and collected at various time points; (a) western blot analysis was used to monitor the activation of AMPK by phosphorylation at Thr 172 and the levels of endogenous POX protein; the bands of phosphorylated-AMPK and POX were analyzed by densitometry. (b) the POX catalytic activity in cells treated with AICAR (0.5 mM) for various durations.was measured. (C) RKO cells were exposed to medium containing AICAR at various concentrations for 24 hours; the cell lysates were harvested, and the POX catalytic activity was determined. (D) RKO cells were treated with AICAR (0.5 mM) in the presence and absence of glucose and the POX catalytic activity was determined. The results are expressed as mean ± S.E. for three separate experiments. * *, p < 0.005 in comparison of AICAR-treated cells versus untreated cells.
Fig. 5
Fig. 5. Effect of glucose withdrawal on MMP-2/ -9 activity and intracellular proline levels
Aa) RKO cells were cultured for 24 hours in serum-free medium with different concentrations of glucose from 5mM (control) to 0.01mM. After treatment the medium was concentrated and equal amounts of protein were analyzed for activation of MMP-2 and MMP–9 by zymography; (b) The graph shows the densitometric analysis of MMP-2 and MMP-9 bands from Fig 5Aa. Cells were exposed to medium with B) decreasing glucose concentrations as indicated; and C) 0.01 mM glucose and collected at various times. After treatment all the cells were harvested and the intracellular proline levels were measured as described in “Materials and Methods.” * *, p < 0.005 in comparison of glucose-deprived cells versus controls.
Fig. 6
Fig. 6. The effect of POX induction on the pentose phosphate pathway
A) RKO cells were exposed to medium with and without rapamycin 10 nmol/L and 14CO2 was collected as described in “Materials and Methods”. B) DLD-POX cells were cultured without doxycycline to induce POX. Control cells were cultured in the presence of doxycycline (20 ng/ml). Cells cultured under both conditions were incubated with glucose-1-14C at concentrations of glucose shown and 14CO2 collected as above. Activities are shown as glucose utilized per hour per mg cell protein. The results are expressed as mean ± S.E. for three separate experiments. C) DLD-POX cells were cultured in medium containing 0.05 mM glucose; with and without doxycycline to induce POX. The cells were lysed and the intracellular ATP levels were measured using a luciferase based assay. The results are expressed as mean ± S.E. for three separate experiments. Statistical comparisons for A: * *, p < 0.005 in comparison versus control; for B & C, * *, p < 0.005 in comparison of cells with POX induced (tet -) versus POX uninduced (tet +).

References

    1. Bates L. Rapid determination of free proline for water-stress studies. Plant Soil. 1973;39:205–207.
    1. Burke B, Giannoudis A, Corke KP, Gill D, Wells M, Ziegler-Heitbrock L, Lewis CE. Hypoxia-induced gene expression in human macrophages: implications for ischemic tissues and hypoxia-regulated gene therapy. Am J Pathol. 2003;163:1233–1243. - PMC - PubMed
    1. Buzzai M, Bauer DE, Jones RG, Deberardinis RJ, Hatzivassiliou G, Elstrom RL, Thompson CB. The glucose dependence of Akt-transformed cells can be reversed by pharmacologic activation of fatty acid beta-oxidation. Oncogene. 2005;24:4165–4173. - PubMed
    1. Chen C, Wanduragala S, Becker DF, Dickman MB. Tomato QM-like protein protects Saccharomyces cerevisiae cells against oxidative stress by regulating intracellular proline levels. Appl Environ Microbiol. 2006;72:4001–4006. - PMC - PubMed
    1. Dang CV, Semenza GL. Oncogenic alterations of metabolism. Trends Biochem Sci. 1999;24:68–72. - PubMed

Publication types