Magnetic interactions sense changes in distance between heme b(L) and the iron-sulfur cluster in cytochrome bc(1)
- PMID: 19415898
- PMCID: PMC2697599
- DOI: 10.1021/bi900511b
Magnetic interactions sense changes in distance between heme b(L) and the iron-sulfur cluster in cytochrome bc(1)
Abstract
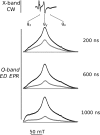
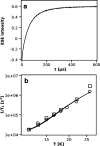
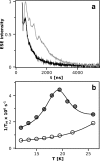
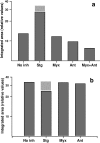
During the operation of cytochrome bc(1), a key enzyme of biological energy conversion, the iron-sulfur head domain of one of the subunits of the catalytic core undergoes a large-scale movement from the catalytic quinone oxidation Q(o) site to cytochrome c(1). This changes a distance between the two iron-two sulfur (FeS) cluster and other cofactors of the redox chains. Although the role and the mechanism of this movement have been intensely studied, they both remain poorly understood, partly because the movement itself is not easily traceable experimentally. Here, we take advantage of magnetic interactions between the reduced FeS cluster and oxidized heme b(L) to use dipolar enhancement of phase relaxation of the FeS cluster as a spectroscopic parameter which with a unique clarity and specificity senses changes in the distance between those two cofactors. The dipolar relaxation curves measured by EPR at Q-band in a glass state of frozen solution (i.e., under the conditions trapping a dynamic distribution of FeS positions that existed in a liquid phase) of isolated cytochrome bc(1) were compared with the curves calculated for the FeS cluster occupying distinct positions in various crystals of cytochrome bc(1). This comparison revealed the existence of a broad distribution of the FeS positions in noninhibited cytochrome bc(1) and demonstrated that the average equilibrium position is modifiable by inhibitors or mutations. To explain the results, we assume that changes in the equilibrium distribution of the FeS positions are the result of modifications of the orienting potential gradient in which the diffusion of the FeS head domain takes place. The measured changes in the phase relaxation enhancement provide the first direct experimental description of changes in the strength of dipolar coupling between the FeS cluster and heme b(L).
Figures


Similar articles
-
Movement of the iron-sulfur head domain of cytochrome bc(1) transiently opens the catalytic Q(o) site for reaction with oxygen.Biochemistry. 2008 Nov 25;47(47):12365-70. doi: 10.1021/bi801207f. Biochemistry. 2008. PMID: 18956890
-
Discrimination between two possible reaction sequences that create potential risk of generation of deleterious radicals by cytochrome bc₁. Implications for the mechanism of superoxide production.Biochim Biophys Acta. 2010 Nov;1797(11):1820-7. doi: 10.1016/j.bbabio.2010.07.005. Epub 2010 Jul 15. Biochim Biophys Acta. 2010. PMID: 20637719 Free PMC article.
-
Functional flexibility of electron flow between quinol oxidation Qo site of cytochrome bc1 and cytochrome c revealed by combinatory effects of mutations in cytochrome b, iron-sulfur protein and cytochrome c1.Biochim Biophys Acta Bioenerg. 2018 Sep;1859(9):754-761. doi: 10.1016/j.bbabio.2018.04.010. Epub 2018 Apr 27. Biochim Biophys Acta Bioenerg. 2018. PMID: 29705394
-
Primary steps in the energy conversion reaction of the cytochrome bc1 complex Qo site.J Bioenerg Biomembr. 1999 Jun;31(3):225-33. doi: 10.1023/a:1005467628660. J Bioenerg Biomembr. 1999. PMID: 10591528 Review.
-
Ubiquinol oxidation in the cytochrome bc1 complex: reaction mechanism and prevention of short-circuiting.Biochim Biophys Acta. 2005 Aug 15;1709(1):5-34. doi: 10.1016/j.bbabio.2005.03.009. Epub 2005 Apr 8. Biochim Biophys Acta. 2005. PMID: 16005845 Review.
Cited by
-
Design and use of photoactive ruthenium complexes to study electron transfer within cytochrome bc1 and from cytochrome bc1 to cytochrome c.Biochim Biophys Acta. 2013 Nov-Dec;1827(11-12):1309-19. doi: 10.1016/j.bbabio.2012.09.002. Epub 2012 Sep 15. Biochim Biophys Acta. 2013. PMID: 22985600 Free PMC article. Review.
-
Fusing two cytochromes b of Rhodobacter capsulatus cytochrome bc1 using various linkers defines a set of protein templates for asymmetric mutagenesis.Protein Eng Des Sel. 2012 Jan;25(1):15-25. doi: 10.1093/protein/gzr055. Epub 2011 Nov 25. Protein Eng Des Sel. 2012. PMID: 22119789 Free PMC article.
-
Catalytically-relevant electron transfer between two hemes bL in the hybrid cytochrome bc1-like complex containing a fusion of Rhodobacter sphaeroides and capsulatus cytochromes b.Biochim Biophys Acta. 2013 Jun;1827(6):751-60. doi: 10.1016/j.bbabio.2013.02.007. Epub 2013 Feb 18. Biochim Biophys Acta. 2013. PMID: 23428397 Free PMC article.
-
Enzymatic activities of isolated cytochrome bc₁-like complexes containing fused cytochrome b subunits with asymmetrically inactivated segments of electron transfer chains.Biochemistry. 2012 Jan 31;51(4):829-35. doi: 10.1021/bi2016316. Epub 2012 Jan 17. Biochemistry. 2012. PMID: 22233445 Free PMC article.
-
Molecular organization of cytochrome c2 near the binding domain of cytochrome bc1 studied by electron spin-lattice relaxation enhancement.J Phys Chem B. 2014 Jun 19;118(24):6634-43. doi: 10.1021/jp503339g. Epub 2014 Jun 5. J Phys Chem B. 2014. PMID: 24845964 Free PMC article.
References
-
- Berry E. A.; Guergova-Kuras M.; Huang L.; Crofts A. R. (2000) Structure and function of cytochrome bc complexes. Annu. Rev. Biochem. 69, 1005–1075. - PubMed
-
- Xia D.; Yu C. A.; Kim H.; Xia J. Z.; Kachurin A. M.; Zhang L.; Yu L.; Deisenhofer J. (1997) Crystal structure of the cytochrome bc1 complex from bovine heart mitochondria. Science 277, 60–66. - PubMed
-
- Iwata S.; Lee J. W.; Okada K.; Lee J. K.; Iwata M.; Rasmussen B.; Link T. A.; Ramaswamy S.; Jap B. K. (1998) Complete structure of the 11-subunit bovine mitochondrial cytochrome bc1 complex. Science 281, 64–71. - PubMed
-
- Zhang Z.; Huang L.; Shulmeister V. M.; Chi Y. I.; Kim K. K.; Hung L. W.; Crofts A. R.; Berry E. A.; Kim S. H. (1998) Electron transfer by domain movement in cytochrome bc1. Nature 392, 677–684. - PubMed
-
- Hunte C.; Koepke J.; Lange C.; Roβmanith T.; Michel H. (2000) Structure at 2.3 Å resolution of the cytochrome bc1 complex from the yeast Saccharomyces cerevisiae co-crystalized with an antibody Fv fragment. Structure 8, 669–684. - PubMed
Publication types
MeSH terms
Substances
Grants and funding
LinkOut - more resources
Full Text Sources
Medical
Miscellaneous

