. 2009 Jun;27(3):499-507.
doi: 10.1089/pho.2008.2331.

Dental enamel irradiated with infrared diode laser and photoabsorbing cream: Part 1 -- FT-Raman Study

Affiliations

Dental enamel irradiated with infrared diode laser and photoabsorbing cream: Part 1 -- FT-Raman Study

Giselle Rodrigues de Sant'anna et al. Photomed Laser Surg. 2009 Jun.

Abstract

Objective: The aim of this FT-Raman study was to investigate laser-induced compositional changes in enamel after therapy with a low-level infrared diode laser and a photoabsorbing cream, in order to intensify the superficial light absorption before and after cariogenic challenge.

Background data: Dental caries remains the most prevalent disease during childhood and adolescence. Preventive modalities include the use of fluoride, reduction of dietary cariogenic refined carbohydrates, plaque removal and oral hygiene techniques, and antimicrobial prescriptions. A relatively simple and noninvasive caries preventive regimen is treating tooth enamel with laser irradiation, either alone or in combination with topical fluoride treatment, resulting in reduced enamel solubility and dissolution rates. Due to their high cost, high-powered lasers are still not widely employed in private practice in developing countries. Thus, low-power red and near-infrared lasers appear to be an appealing alternative.

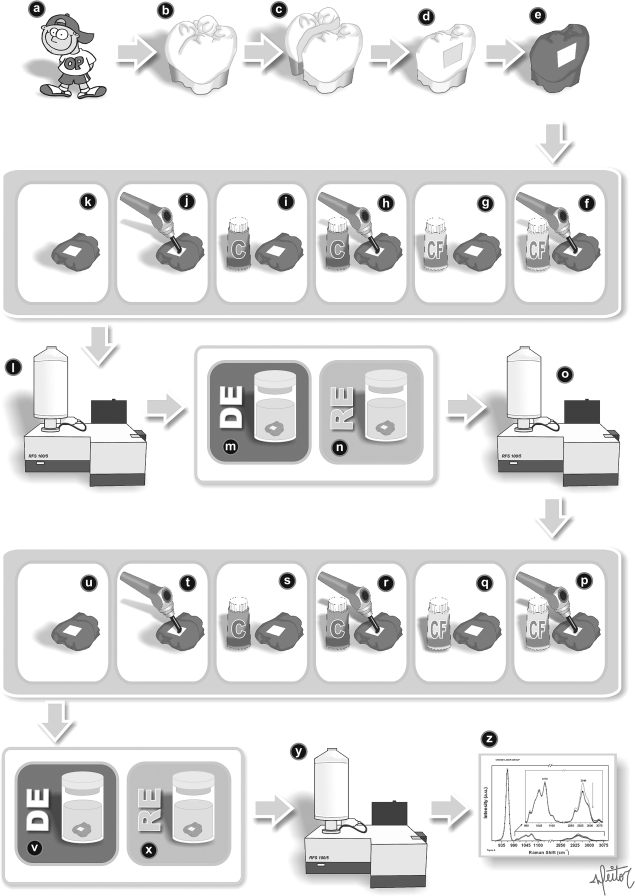
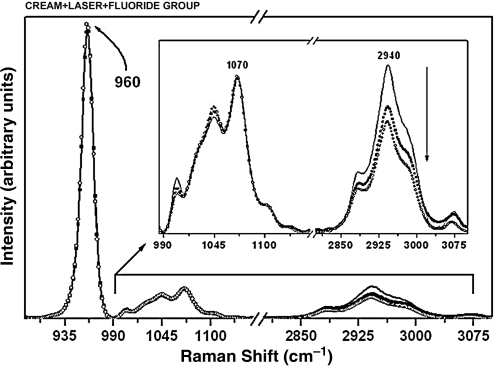
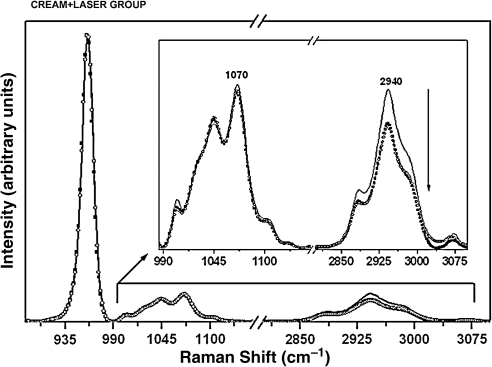
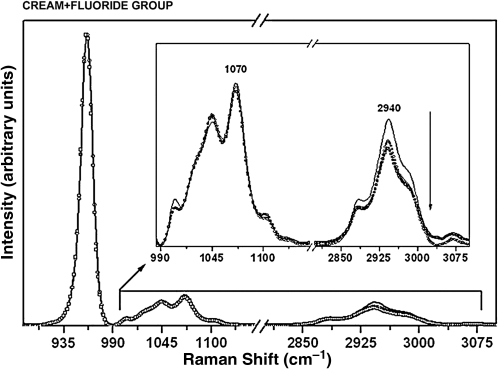
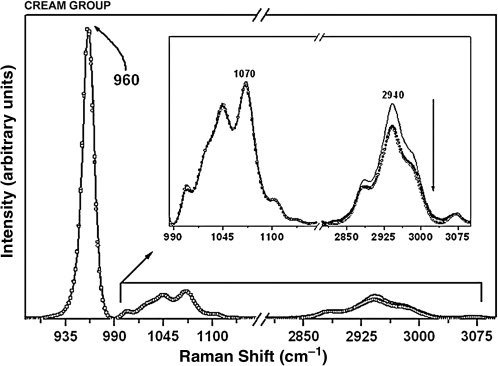
Materials and methods: Twenty-four extracted or exfoliated caries-free deciduous molars were divided into six groups: control group (no treatment; n = 8); infrared laser treatment (L; n = 8) (810 nm at 100 mW/cm(2) for 90 sec); infrared diode laser irradiation (810 nm at 100 mW/cm(2) for 90 sec) and photoabsorbing cream (IVL; n = 8); photoabsorbing cream alone (IV; n = 8); infrared diode laser irradiation (810 nm at 100 mW/cm(2) for 90 sec) and fluorinated photoabsorbing agent (IVLF; n = 8); and fluorinated photoabsorbing agent alone (IVF; n = 8). Samples were analyzed using FT-Raman spectroscopy before and after pH cycling cariogenic challenge.

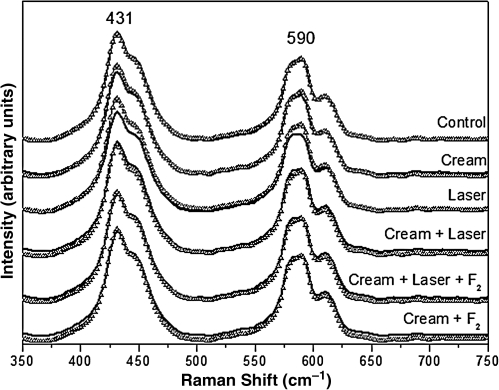
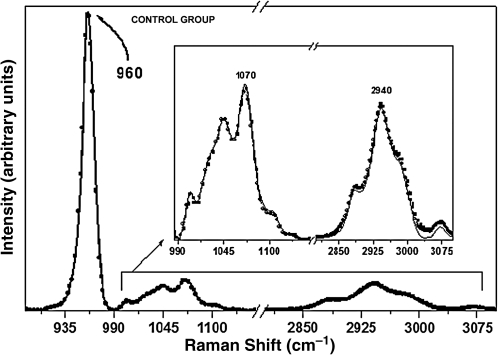
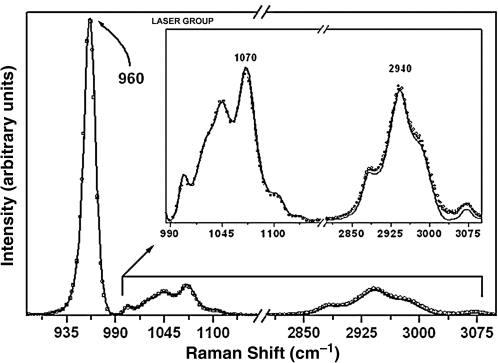
Results: There was a significant laser-induced reduction and possible modification of the organic matrix content in enamel treated with the low-level diode laser (the L, IVL, and IVFL groups).

Conclusion: The FT-Raman technique may be suitable for detecting compositional and structural changes occurring in mineral phases and organic phases of lased enamel under cariogenic challenge.


Figures

FIG. 1.
FIG. 1.
(a, b) Posterior caries free deciduous teeth were selected. (c) Samples of buccal and lingual faces were obtained. (d, e) Selected samples prepared with acid–resistance varnish. (f) Fluoride cream group irradiated with laser. (g) Fluoride cream treatment group. (h) Cream group irradiated with laser. (i) Cream treatment group. (j) Laser treatment group. (k) Control group (no treatment). (l) Raman spectroscopy. (m, n) First challenge, pH cycling during 7 days-De (8 h) and Re (16 h). (o) Raman spectroscopy; (p–t) Samples treated again in the same way of first set. (u) Control group received no treatment. (v,x) Second challenge, pH cycling during 7 days-De (8 h) and Re (16 h). (y) Raman spectroscopy. (z) Data treatment and spectras.
FIG. 2.
FIG. 2.
Spectra of the mineral components.
FIG. 3.
FIG. 3.
Raman spectra of the enamel with the phosphate peak at 960 cm−1, the carbonate peak at 1070 cm−1, and organic matter peak at 2940 cm−1 for the specimens from the control group pre-treatment (solid black line), after the first cariogenic challenge (circles), and after the second cariogenic challenge (squares). The arrow indicates intensity reduction. (Inset) Raman spectra in the 990–3100 cm−1 range, showing the components associated with the carbonate and organic sample content.
FIG. 4.
FIG. 4.
Raman spectra of the enamel with the phosphate peak at 960 cm−1, the carbonate peak at 1070 cm−1, and organic matter peak at 2940 cm−1 for the specimens from laser-treated group at pre-treatment (solid black line), after the first cariogenic challenge (circles), and after the second cariogenic challenge (squares). The arrow indicates intensity reduction. (Inset) Raman spectra in the 990–3100 cm−1 range, showing the components associated with the carbonate and organic sample content.
FIG. 5.
FIG. 5.
Raman spectra of the enamel with the phosphate peak at 960 cm−1, the carbonate peak at 1070 cm−1, and organic matter peak at 2940 cm−1 for the specimens from the cream + laser + fluoride group at pre-treatment (solid black line), after the first cariogenic challenge (circles), and after the second cariogenic challenge (squares). The arrow indicates intensity reduction. (Inset) Raman spectra in the 990–3100 cm−1 range, showing the components associated with the carbonate and organic sample content.
FIG. 6.
FIG. 6.
Raman spectra of the enamel with the phosphate peak at 960 cm−1, the carbonate peak at 1070 cm−1, and organic matter peak at 2940 cm−1 for the specimens from the cream + laser-treated group at pre-treatment (solid black line), after the first cariogenic challenge (circles), and after the second cariogenic challenge (squares). The arrow indicates intensity reduction. (Inset) Raman spectra in the 990–3100 cm−1 range, showing the components associated with the carbonate and organic sample content.
FIG. 7.
FIG. 7.
Raman spectra of the enamel with the phosphate peak at 960 cm−1, the carbonate peak at 1070 cm−1, and organic matter peak at 2940 cm−1 for the specimens in the cream + fluoride group at pre-treatment (solid black line), after the first cariogenic challenge (circles), and after the second cariogenic challenge (squares). The arrow indicates intensity reduction. (Inset) Raman spectra in the 990–3100 cm−1 range, showing the components associated with the carbonate and organic sample content.
FIG. 8.
FIG. 8.
Raman spectra of the enamel with the phosphate peak at 960 cm−1, the carbonate peak at 1070 cm−1, and organic matter peak at 2940 cm−1 for the specimens in the cream-only group at pre-treatment (solid black line), after the first cariogenic challenge (circles), and after the second cariogenic challenge (squares). The arrow indicates intensity reduction. (Inset) Raman spectra in the 990–3100 cm−1 range, showing the components associated with the carbonate and organic sample content.

References

    1. U.S. Department of Health and Human Services, National Institute of Dental and Craniofacial Research, and National Institutes of Health. J. Calif. Dent. Assoc. 2000;28:685. - PubMed
    1. Lima Y.B.O. Cury J.A. Seasonal variation of fluoride intake by children in a subtropical region. Caries Res. 2003;37:335–338. - PubMed
    1. Ana P.A. Bachmann L. Zezell D.M. Lasers effects on enamel for caries prevention. Laser Physics. 2006;16:865–875.
    1. Rodrigues L.K.A. Santos M.N. Pereira D. Assaf A.V. Pardi V. Carbon dioxide laser in dental caries prevention. J. Dent. 2004;32:531–540. - PubMed
    1. Hugo F.N. Vale G.C. Ccahuana-Vásquez R.A. Cypriano S. de Sousa M.L. Polarization of dental caries among individuals aged 15 to 18 years. J. Appl. Oral Sci. 2007;15:253–258. - PMC - PubMed

Publication types