. 2009 May 5:4:15.
doi: 10.1186/1749-8104-4-15.

Cyclin D1 fine-tunes the neurogenic output of embryonic retinal progenitor cells

Affiliations

Cyclin D1 fine-tunes the neurogenic output of embryonic retinal progenitor cells

Gaurav Das et al. Neural Dev. .

Abstract

Background: Maintaining the correct balance of proliferation versus differentiation in retinal progenitor cells (RPCs) is essential for proper development of the retina. The cell cycle regulator cyclin D1 is expressed in RPCs, and mice with a targeted null allele at the cyclin D1 locus (Ccnd1-/-) have microphthalmia and hypocellular retinas, the latter phenotype attributed to reduced RPC proliferation and increased photoreceptor cell death during the postnatal period. How cyclin D1 influences RPC behavior, especially during the embryonic period, is unclear.

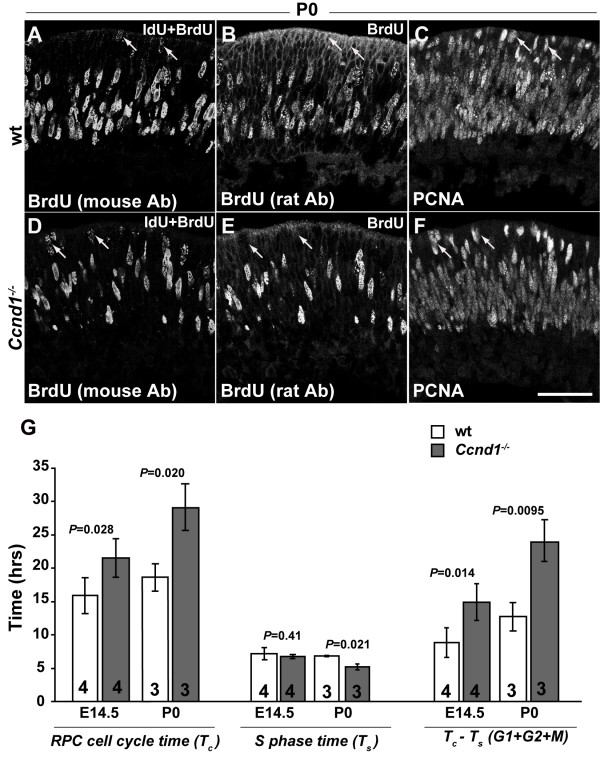
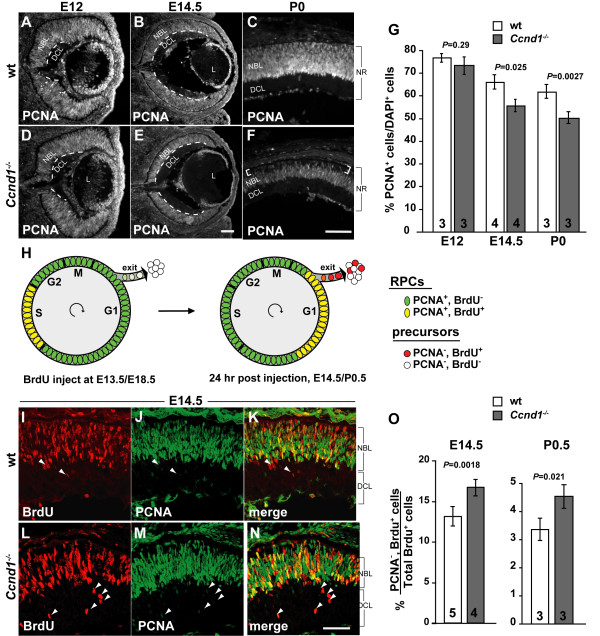
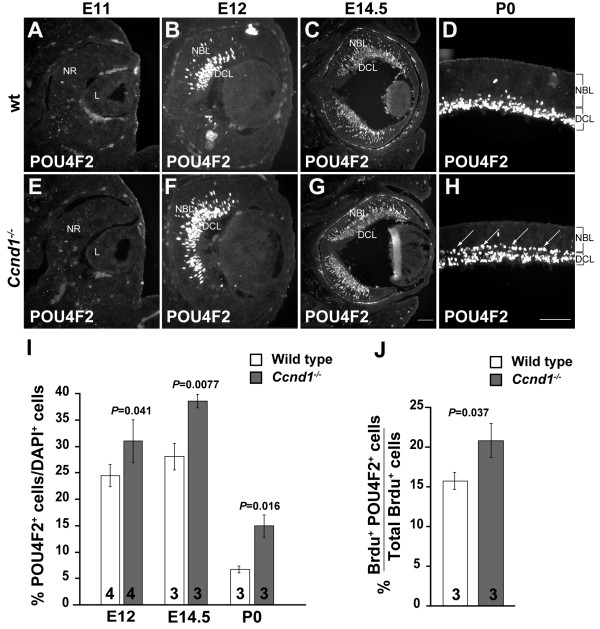
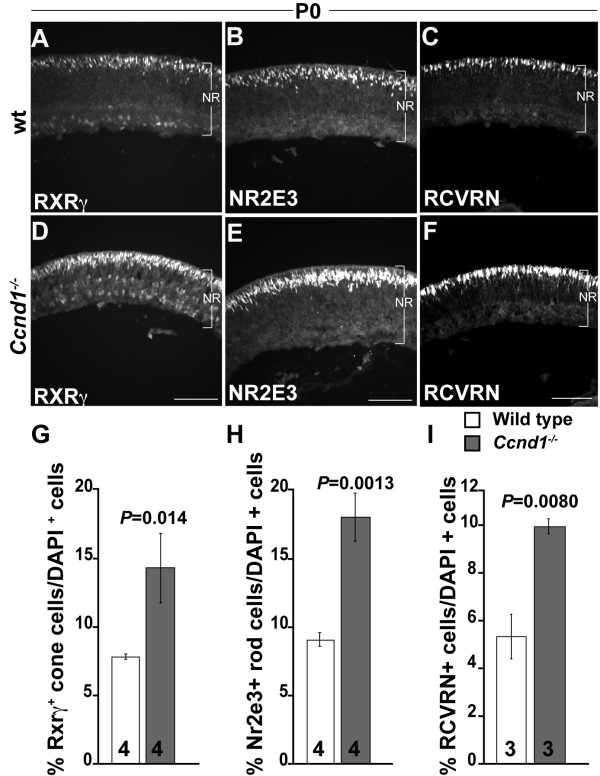
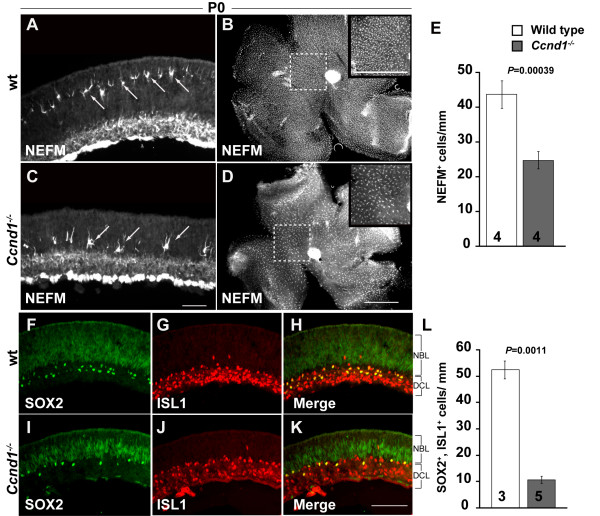
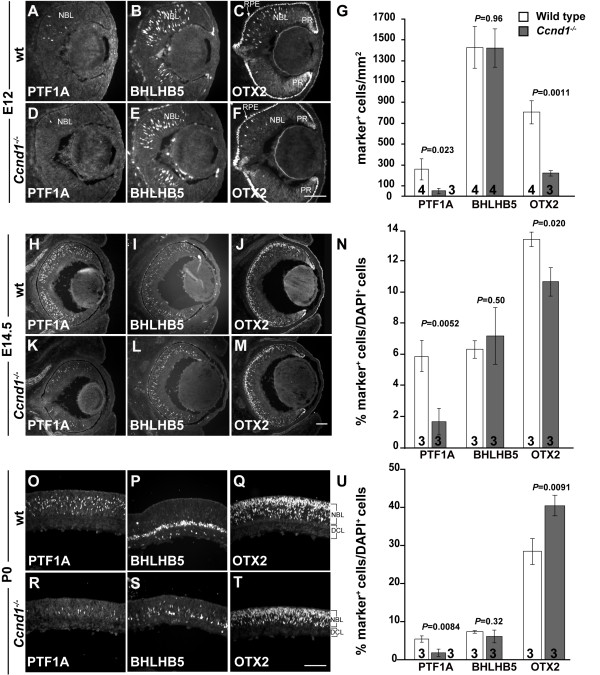
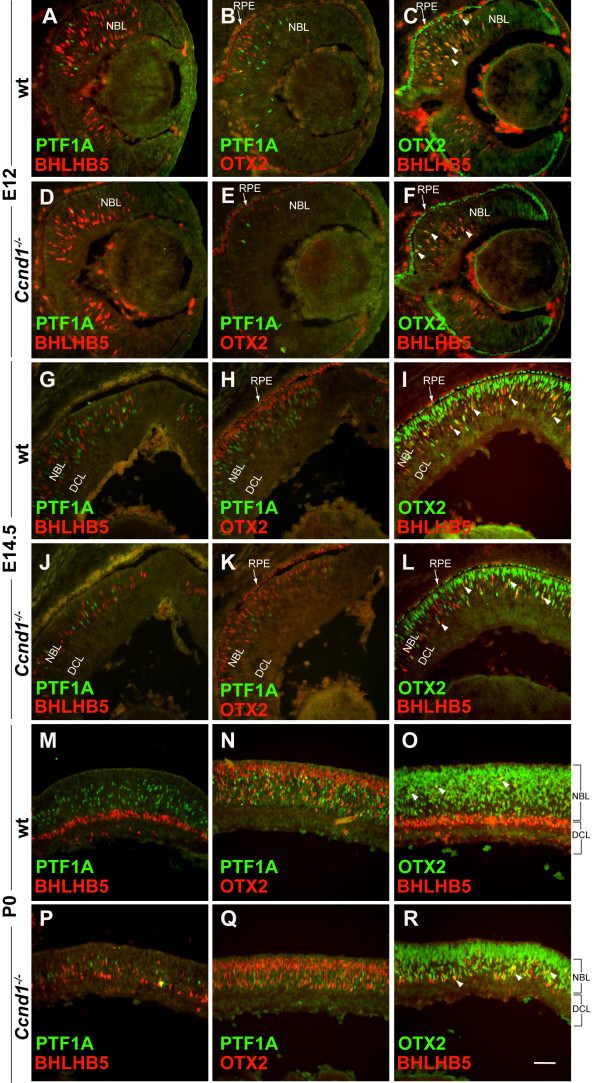
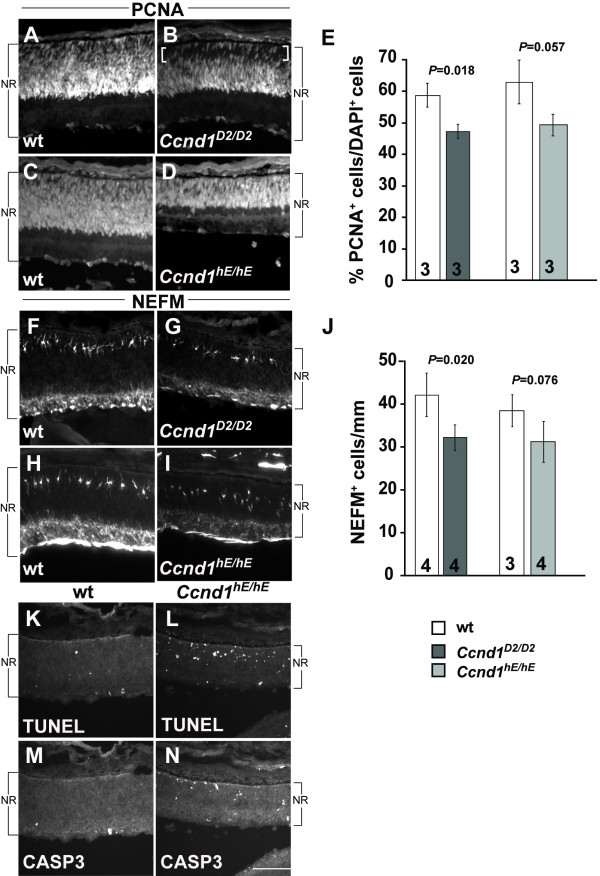
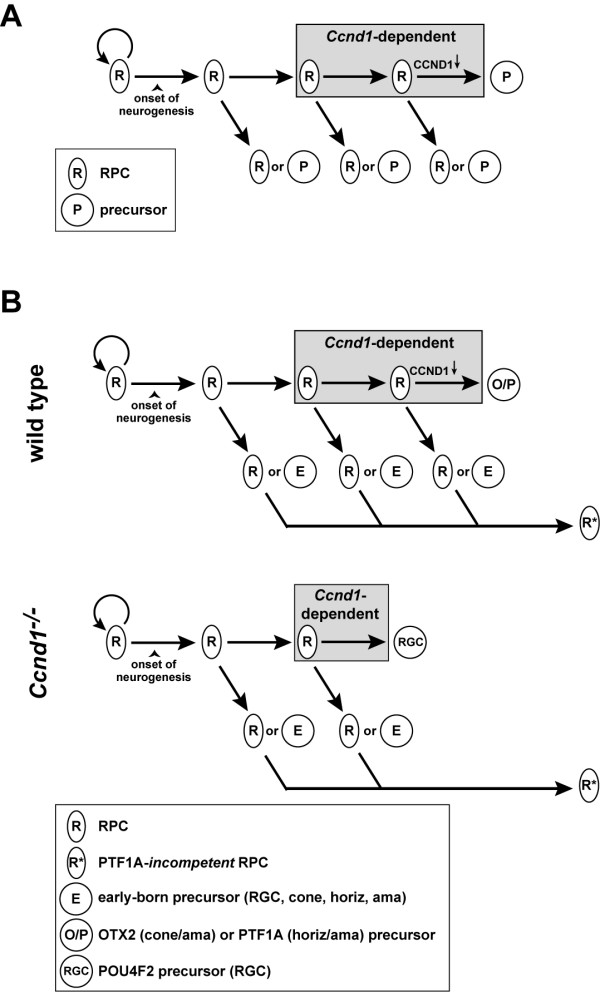
Results: In this study, we show that embryonic RPCs lacking cyclin D1 progress through the cell cycle at a slower rate and exit the cell cycle at a faster rate. Consistent with enhanced cell cycle exit, the relative proportions of cell types born in the embryonic period, such as retinal ganglion cells and photoreceptor cells, are increased. Unexpectedly, cyclin D1 deficiency decreases the proportions of other early born retinal neurons, namely horizontal cells and specific amacrine cell types. We also found that the laminar positioning of horizontal cells and other cell types is altered in the absence of cyclin D1. Genetically replacing cyclin D1 with cyclin D2 is not efficient at correcting the phenotypes due to the cyclin D1 deficiency, which suggests the D-cyclins are not fully redundant. Replacement with cyclin E or inactivation of cyclin-dependent kinase inhibitor p27Kip1 restores the balance of RPCs and retinal cell types to more normal distributions, which suggests that regulation of the retinoblastoma pathway is an important function for cyclin D1 during embryonic retinal development.

Conclusion: Our findings show that cyclin D1 has important roles in RPC cell cycle regulation and retinal histogenesis. The reduction in the RPC population due to a longer cell cycle time and to an enhanced rate of cell cycle exit are likely to be the primary factors driving retinal hypocellularity and altered output of precursor populations in the embryonic Ccnd1-/- retina.


Figures

Figure 1
Figure 1
Expression patterns of CCND1 and acTUBB3 during early retinal development. Wild-type retinas were double-labeled with antibodies against (A-D) CCND1 and (E-H) acTUBB3. (I-L) Merged images. Dashed lines indicate the peripheral extent of strong CCND1+ cells in retinas from E11 (B, F, J), E12 (C, G, K), and E14.5 (D, H, L) embryos. Asterisks in (A, E, I) indicate that this region of the neuroepithelium is folded over in the section. Abbreviations: D, diencephalon; DCL, differentiated cell layer; L, lens; NBL, neuroblast layer; NR, neural retina; OV, optic vesicle; PNR, presumptive neural retina; SE, surface ectoderm. Scale bars: 100 μm; (K) is representative for (A-C, E-G, I-K); (L) is representative for (D, H, L).
Figure 2
Figure 2
Retinal progenitor cell (RPC) cell cycle is lengthened in the Ccnd1-/- retina. P0 wild-type and Ccnd1-/- retinas, cultured successively in iododeoxyuridine (IdU) for 2 hours and bromodeoxyuridine (BrdU) for 30 minutes, were triple-stained with mouse (A, D) anti-BrdU antibody (Ab) recognizing both IdU and BrdU, (B, E) rat anti-BrdU antibody recognizing only BrdU, and (C, F) with an antibody against PCNA marking RPCs. Arrows in (A-C) mark IdU+ only RPCs (IdU+, BrdU-; positive signal in (A, C) but not (B)) in wild-type retina that have moved up to the apical surface during the labeling period. Arrows in (D-F) mark IdU+ only RPCs (positive signal in (D, F) but not (E)) in the Ccnd1-/- retina during the same period. (G) Quantification of average RPC cell cycle time (Tc), S phase time (Ts) and G1 + G2 + M phase time (Tc - Ts) in wild-type (wt) and Ccnd1-/- retinas at E14.5 and P0. Scale bar: 50 μm; (F) is representative for (A-F).
Figure 3
Figure 3
Gradual depletion of retinal progenitor cell (RPC) population in the Ccnd1-/- retina is caused by enhanced cell cycle exit. (A-F) Wild-type (wt) and Ccnd1-/- retinas were labeled with an antibody against PCNA from E12 to P0. Dashed lines in (A, B, D, E) demarcate the differentiated cell layer (DCL) from the neuroblast layer (NBL). Brackets in (F) show the 'apical gap' in the P0 mutant retina. (G) Quantification of PCNA+ cells from E12, E14.5 and P0 retinas. (H) Schematic representation of cell cycle exit assay. (I-N) Wild-type and Ccnd1-/- retina samples, collected at 24 h following a single bromodeoxyuridine (BrdU) injection at E13.5, were co-labeled with antibodies against PCNA and BrdU to measure rate of cell cycle exit, as outlined in (H). Arrowheads in (I-N) indicate cells that had exited the cell cycle in the last 24 h. (O) Quantification of exited cells (BrdU+, PCNA-) as a percentage of BrdU+ cells at E14 and P0.5. Abbreviations: DCL, differentiated cell layer; L, lens; NBL; neuroblast layer NR; neural retina. Scale bars: 100 μm; (E) is representative for (B, E); (F) for (A, C, D, F); (N) for (I-N).
Figure 4
Figure 4
Retinal ganglion cells (RGCs) are overproduced in the Ccnd1-/- retina. (A-H) Wild-type (wt) and Ccnd1-/- retinas were stained with an antibody against POU4F2, which marks a majority of RGCs, at E11, E12, E14.5 and P0. Arrows in (H) mark the extra layer of RGCs in the Ccnd1-/- retina at P0. (I) Quantification of relative proportions of POU4F2+ RGCs. (J) Quantification of relative rate of POU4F2+ RGC production between E13.5 to E14.5. Abbreviations: DCL, differentiated cell layer; L, lens; NBL, neuroblast layer; NR, neural retina. Scale bars: 100 μm; (G) is representative for (C, G); (H) for (A, B, D, E, F, H).
Figure 5
Figure 5
Proportion of photoreceptor cells is increased in the Ccnd1-/- retina. Expression pattern of cone precursor marker (A, D) RXRγ, (B, E) rod precursor marker NR2E3, and (C, F) general photoreceptor marker RCVRN at P0. (G-I) Quantification of relative proportions of RXRγ+, NR2E3+ RCVRN+ cells, respectively, at P0. Abbreviations: NR, neural retina. Scale bars: 100 μm (D) is representative for (A, D); (E) for (B, E); (F) for (C, F).
Figure 6
Figure 6
Reduced densities of horizontal and amacrine cells in the Ccnd1-/- retina. (A, C) Expression pattern of NEFM at P0 is shown. Arrows point to representative horizontal cells. Bright staining in the differentiated cell layer (DCL) is due to NEFM expression in retinal ganglion cells (RGCs). (B, D) Retinal whole mounts stained with NEFM antibody reveal differences in horizontal cell density across retina. Tissues were imaged from basal surface to reduce interference from NEFM immunoreactivity in RGCs. Insets show boxed regions. (E) Quantification of NEFM+ horizontal cells at P0. (F-K) Expression patterns of SOX2 (F, I) and ISL1 (G, J) at P0 (merged images in (H, K)) are shown. (L) Quantification of SOX2+, ISL1B+ amacrine cells at P0. Abbreviations: DCL, differentiated cell layer; NBL; neuroblast layer. Scale bars: 100 μm; (C) is representative for (A, C); (D) for (B, D).
Figure 7
Figure 7
Ccnd1-deficiency causes alterations in the proportions of precursor cell populations. Expression patterns of (A, D, H, K, O, R) PTF1A, (B, C, I, L, P, S) BHLHB5 and (C, F, J, M, Q, T) OTX2 at E12 (A-F), E14.5 (H-M), and P0 (O-T) are shown. (G, N, U) Quantification of marker+ cells at E12 (G), E14.5 (N), and P0 (U). Abbreviations: DCL, differentiated cell layer; NBL, neuroblast layer; PR, peripheral retina; RPE, retinal pigmented epithelium. Scale bar: 100 μm; (F) is representative for (A-F); (M) for (H-M); (T) for (O-T).
Figure 8
Figure 8
Relationship between PTF1A+, BHLHB5+, and OTX2+ precursors. Retinal sections at (A-F) E12, (G-L) E14.5, and (M-R) P0 were double-labeled with combinations of antibodies against PTF1A, BHLHB5 and OTX2. Arrowheads in (C, F, I, L, O, R) show examples of cell co-expressing OTX2 and BHLHB5. Arrows in (B, C, E, F, H, I, K, L) point to the retinal pigmented epithelium (RPE). Abbreviations: DCL, differentiated cell layer; NBL, neuroblast layer; RPE, retinal pigmented epithelium; wt, wild type. Scale bar: 100 μm; (R) is representative for all panels.
Figure 9
Figure 9
Analysis of Ccnd1D2/D2 and Ccnd1hE/hE retinas at P0. (A-D) Expression pattern of PCNA) in Ccnd1D2/D2 retina (B), Ccnd1hE/hE retina (D) and their respective wild-type (wt) controls (A, C) is shown. (E) Quantification of proportions of PCNA+ cells. (F-I) Expression pattern of NEFM in Ccnd1D2/D2 retina (G), Ccnd1hE/hE retina (I) and their respective wild-type controls (F, H) is shown. (J) Quantification of NEFM+ cells. (K, L) TUNEL labeling in wild-type (K) and Ccnd1hE/hE retina (L). (M, N) Activated CASP3 immunoreactivity in wild-type (M) and Ccnd1hE/hE retina (N). Brackets in (B) show the 'apical gap' in the P0 Ccnd1D2/D2 retina. Abbreviations: NR, neural retina. Scale bar: 100 μm (N is representative for all panels).
Figure 10
Figure 10
Models of Ccnd1 function in the retina. (A) General model of Ccnd1-dependence in retinal progenitor cells (RPCs). Most, if not all RPCs express CCND1. At least one division before cell cycle exit, RPCs become dependent on CCND1 to remain in the cell cycle (RPCs in gray box). Those that retain sufficiently high Ccnd1 levels or activity continue to divide whereas those that drop below a threshold will produce at least one post-mitotic precursor cell (P). It is not known if the other daughters of each division are Ccnd1-dependent, nor is the mode of division known for Ccnd1-dependent RPCs. It is presumed that at least some of the RPCs that persist contribute to the RPC population at later stages. (B) Model of how cell production is altered in the absence of Ccnd1 during early retinal development. In the wild-type retina, a proportion of CCND1-dependent RPCs will produce precursors that differentiate into cone, horizontal, or amacrine cells (O/P). In the Ccnd1-/- retina, Ccnd1-dependent RPCs exit at least one division sooner, resulting in a gradual reduction in the size of the RPC population and an enhancement in the relative production of retinal ganglion cell (RGC) precursors at the expense of other precursor types. This could be due to an instructive role for Ccnd1 in cell fate specification or to a consequence of RPC competence and/or altered environment at the time of exit. The inability of RPCs to replenish the PTF1A precursor population (as it does for the OTX2 precursor population) suggests that most RPCs lose their competence to make PTF1A precursors (R*). Similar mechanisms may influence the output of other precursor populations.

Similar articles

Cited by

References

    1. Jeon CJ, Strettoi E, Masland RH. The major cell populations of the mouse retina. J Neurosci. 1998;18:8936–8946. - PMC - PubMed
    1. Rapaport DH, Wong LL, Wood ED, Yasumura D, LaVail MM. Timing and topography of cell genesis in the rat retina. J Comp Neurol. 2004;474:304–324. doi: 10.1002/cne.20134. - DOI - PubMed
    1. Finlay BL. The developing and evolving retina: using time to organize form. Brain Res. 2008;1192:5–16. doi: 10.1016/j.brainres.2007.07.005. - DOI - PubMed
    1. Farah MH, Easter SS., Jr Cell birth and death in the mouse retinal ganglion cell layer. J Comp Neurol. 2005;489:120–134. doi: 10.1002/cne.20615. - DOI - PubMed
    1. Strom RC, Williams RW. Cell production and cell death in the generation of variation in neuron number. J Neurosci. 1998;18:9948–9953. - PMC - PubMed

Publication types

MeSH terms