. 2009 May 5:3:46.
doi: 10.1186/1752-0509-3-46.

Genetic and environmental pathways to complex diseases

Affiliations

Genetic and environmental pathways to complex diseases

Julia M Gohlke et al. BMC Syst Biol. .

Abstract

Background: Pathogenesis of complex diseases involves the integration of genetic and environmental factors over time, making it particularly difficult to tease apart relationships between phenotype, genotype, and environmental factors using traditional experimental approaches.

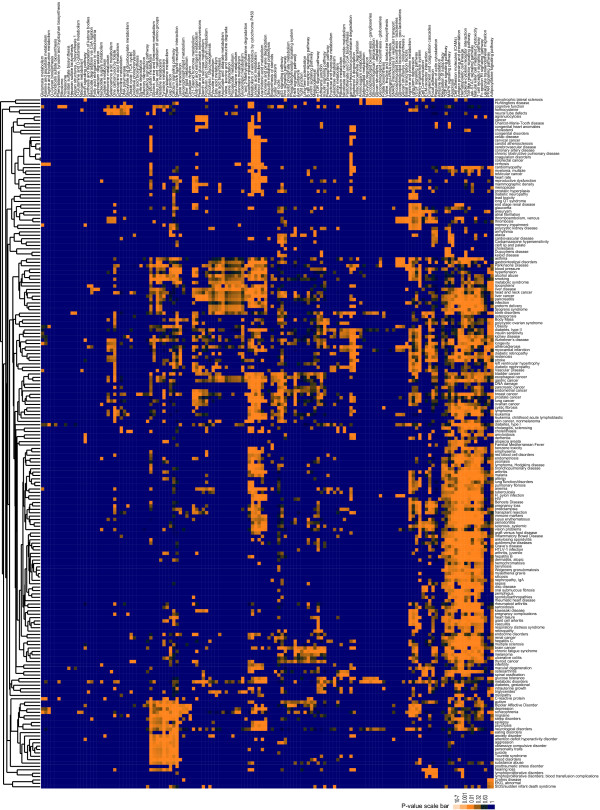
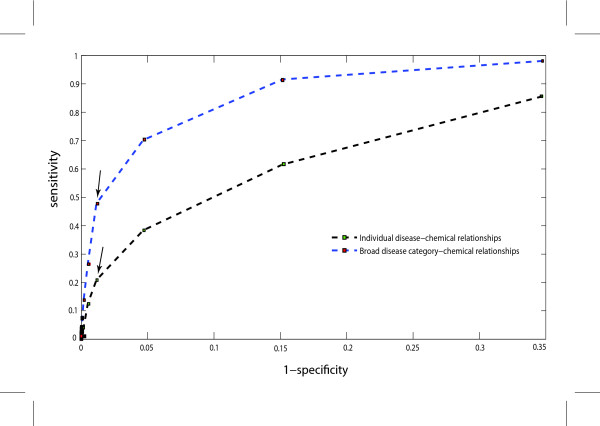
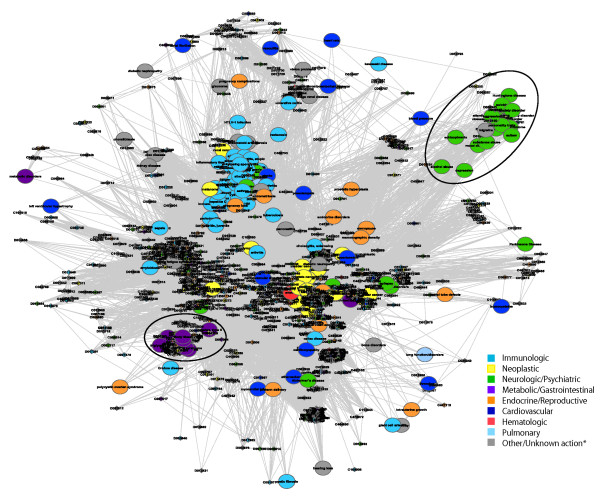
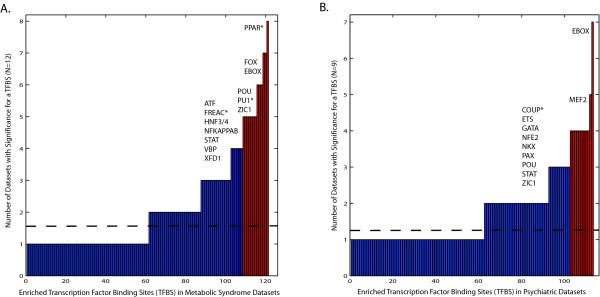
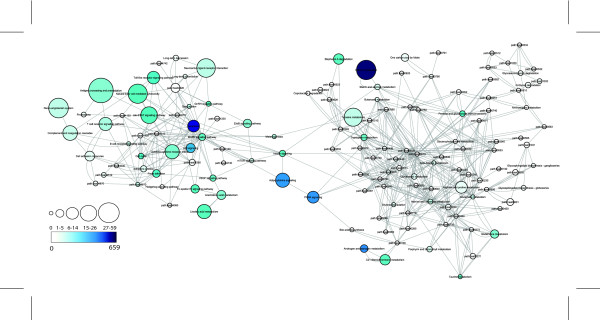
Results: Using gene-centered databases, we have developed a network of complex diseases and environmental factors through the identification of key molecular pathways associated with both genetic and environmental contributions. Comparison with known chemical disease relationships and analysis of transcriptional regulation from gene expression datasets for several environmental factors and phenotypes clustered in a metabolic syndrome and neuropsychiatric subnetwork supports our network hypotheses. This analysis identifies natural and synthetic retinoids, antipsychotic medications, Omega 3 fatty acids, and pyrethroid pesticides as potential environmental modulators of metabolic syndrome phenotypes through PPAR and adipocytokine signaling and organophosphate pesticides as potential environmental modulators of neuropsychiatric phenotypes.

Conclusion: Identification of key regulatory pathways that integrate genetic and environmental modulators define disease associated targets that will allow for efficient screening of large numbers of environmental factors, screening that could set priorities for further research and guide public health decisions.


Figures

Figure 1
Figure 1
Unsupervised Hierarchical Cluster of Phenotypes by Pathways. Genes associated with a particular phenotype were evaluated for enrichment in KEGG pathways using SEPEA. P-values for KEGG pathway enrichment were then clustered using Spearman rank correlation in Cluster and the graphic was prepared using TreeView [73], where color ranges linearly from blue (p = 1) to orange (p = 0). Phenotype-gene relationships were downloaded from the Genetic Association Database [1] in June 2007 and phenotypes were further grouped according to Additional file 1. Request the TreeView file of this cluster from Julia Gohlke gohlkej@niehs.nih.gov for more detailed exploration.
Figure 2
Figure 2
Receiver operating characteristic (ROC) curve. A graphical representation of the sensitivity versus (1-specificity) comparing environmental factor-phenotype predictions at different p-value cutoffs to a manually curated set of direct chemical-disease relationships from the Comparative Toxicogenomics Database [16] using either specific diseases or broad categorizations of diseases. The SEPEA pathway enrichment p-value cutoff of 0.003 is indicated with arrows for each analysis.
Figure 3
Figure 3
Interaction Network of Phenotypes and Environmental Factors. Phenotypes are represented as circular nodes and environmental factors as diamond shaped nodes. Edges represent sharing at least two significantly enriched pathways (p ≤ 0.003) using lists of genes associated with a particular phenotype or environmental factor, according to the phenotype-gene relationships in the Genetic Association Database [1] or the environmental factor-gene relationships found in the Comparative Toxicogenomics Database[15], respectively. MeSH IDs are used as environmental factor node labels. Environmental factors with pharmacological or toxicological action in the MeSH record are color coded based on broad phenotype categories according to annotation in Additional file 2. *Phenotypes which do not fit into a specific category or environmental factors with undetermined pharmacological or toxicological action are gray. Request the Cytoscape session file of this network from Julia Gohlke gohlkej@niehs.nih.gov for more detailed exploration. Annotation of the circled metabolic syndrome and neuropsychiatric subnetworks can be found in Additional file 3.
Figure 4
Figure 4
Gene expression regulation across microarray datasets. Enriched transcription factor binding sites (tfbs) were identified in evolutionarily conserved regions surrounding differentially up and downregulated genes from metabolic (A.) or neuropsychiatric (B.) microarray datasets identified in Table 1 (see Methods). Results for each microarray dataset are presented in Additional file 4. The mean frequency of identifying a particular tfbs enriched in a dataset was 13% (dotted line). Those enriched tfbs that are consistently identified across the metabolic (A.) or neuropsychiatric (B.) datasets are color coded red (p ≤ 0.005), whereas those tfbs that are specific to the metabolic datasets versus neuropsychiatric datasets and vice versa (p ≤ 0.05) are identified with an asterisk.
Figure 5
Figure 5
Pathway Interaction Network. Nodes represent KEGG metabolic and signaling pathways and are connected based on the KEGG database [72]. Node size is reflective of the number of phenotypes associated with the particular pathway based on application of SEPEA (p ≤ 0.003) to gene lists annotated from The Genetic Association Database[1]. Intensity of node color is reflective of the number of environmental factors associated with the particular pathway based on enrichment of gene lists annotated from The Comparative Toxicogenomics Database[15].

References

    1. Becker KG, Barnes KC, Bright TJ, Wang SA. The Genetic Association Database. Nature Genetics. 2004;36:431–432. doi: 10.1038/ng0504-431. - DOI - PubMed
    1. McKusick VA. Mendelian inheritance in man and its online version, OMIM. American Journal of Human Genetics. 2007;80:588–604. doi: 10.1086/514346. - DOI - PMC - PubMed
    1. Antonarakis SE, Beckmann JS. Opinion – Mendelian disorders deserve more attention. Nature Reviews Genetics. 2006;7:277–282. doi: 10.1038/nrg1826. - DOI - PubMed
    1. Gwinn M, Khoury MJ. Genomics and public health in the United States: Signposts on the translation highway. Community Genetics. 2006;9:21–26. doi: 10.1159/000090689. - DOI - PubMed
    1. Kleeberger SR, Peden D. Gene-environment interactions in asthma and other respiratory diseases. Annual Review of Medicine. 2005;56:383–400. doi: 10.1146/annurev.med.56.062904.144908. - DOI - PubMed

Publication types

LinkOut - more resources