. 2009 Jul 1;487(1):42-8.
doi: 10.1016/j.abb.2009.04.009. Epub 2009 May 3.

Microsomal glutathione transferase 1 exhibits one-third-of-the-sites-reactivity towards glutathione

Affiliations

Microsomal glutathione transferase 1 exhibits one-third-of-the-sites-reactivity towards glutathione

Johan Alander et al. Arch Biochem Biophys. .

Abstract

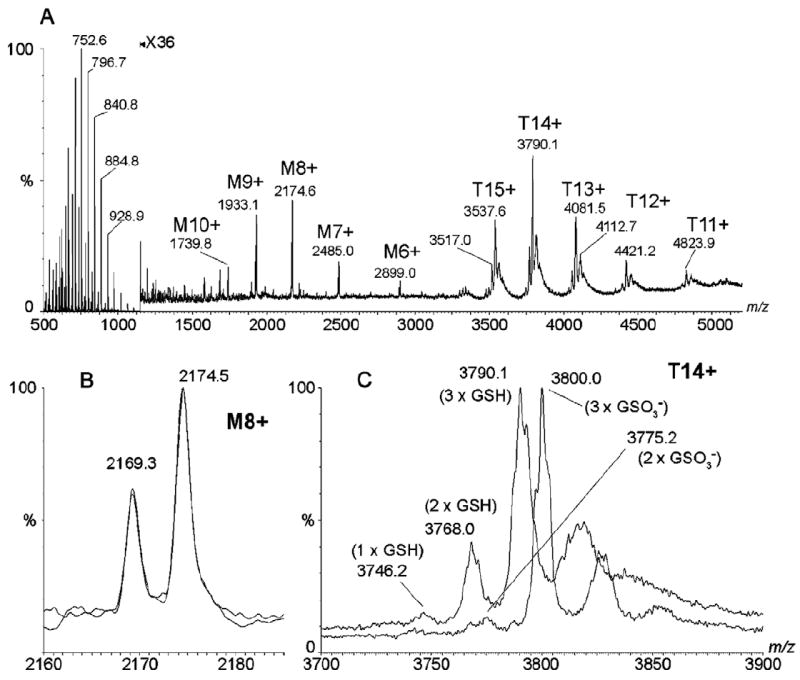
The trimeric membrane protein microsomal glutathione transferase 1 (MGST1) possesses glutathione transferase and peroxidase activity. Previous data indicated one active site/trimer whereas structural data suggests three GSH-binding sites. Here we have determined ligand interactions of MGST1 by several techniques. Nanoelectrospray mass spectrometry of native MGST1 revealed binding of three GSH molecules/trimer and equilibrium dialysis showed three product molecules/trimer (K(d)=320+/-50 microM). All three product molecules could be competed out with GSH. Reinvestigation of GSH-binding showed one high affinity site per trimer, consistent with earlier data. Using single turnover stopped flow kinetic measurements, K(d) could be determined for a low affinity GSH-binding site (2.5+/-0.5 mM). Thus we can reconcile previous observations and show here that MGST1 contains three active sites with different affinities for GSH and that only the high affinity site is catalytically competent.


Figures

Fig. 1
Fig. 1
MGST1 binds three GSH molecules per trimer. Automated nanoelectrospray mass spectrometry analysis of MGST1–substrate/inhibitor complexes. In A is shown the full mass range (m/z 500–5000) for the analysis of detergent solubilised MGST1 in the presence of 0.1 mM GSH. Monomeric and trimeric enzyme forms are indicated by M and T, respectively. In B is shown the overlaid spectra of the 8+ monomeric charge state of MGST1 in the presence of 0.1 mM GSH alone and with equimolar amounts of GSH/GSO3. In C is shown the same spectra as in B for the m/z range of the most abundant trimeric charge state. Peaks corresponding to the binding of substrate/inhibitor molecules are indicated.
Fig. 2
Fig. 2
Binding of GSH to MGST1 analysed by equilibrium dialysis. GSH-free MGST1 was mixed with varying 35S-GSH concentrations (5–1000 μM) as described in Experimental procedures. After equilibration overnight the partitioning of GSH was measured by scintillation counting and the data were fitted to a one site binding hyperbolic equation. Enzyme concentrations varied between 29 and 31 μM trimer in different experiments (n = 3). The insert shows a magnification of the plot for clarity.
Fig. 3
Fig. 3
Binding of the product GSDNB to MGST1 analysed by equilibrium dialysis. GSH-free MGST1 was mixed with varying GSDNB concentrations (50–1000 μM) as described in Experimental procedures. After equilibration overnight the partitioning of GSDNB was measured spectrophotometrically and the data were fitted to a one site binding hyperbolic equation. Enzyme concentrations varied between 26 and 35 μM trimer in different experiments. Each point represents a separate experiment.
Fig. 4
Fig. 4
GSH competition experiment against MGST1-bound GSDNB. GSH-free MGST1 was mixed with varying GSH concentration (0–22 mM) and 800 μM GSDNB as described in Experimental procedures. After equilibration overnight the partitioning of GSDNB was measured spectrophotometrically. Enzyme concentrations varied between 17 and 23 μM trimer in different experiments (n = 6).
Fig. 5
Fig. 5
GSH-binding to MGST1 that already has two GSH molecules bound. Single turnover experiment where GSH-bound MGST1 is rapidly mixed with CDNB at a ratio of 1/trimer. Thiolate anion re-formation was recorded after the initial burst (17 μM CDNB vs. 14 μM MGST1-trimer). (A) The increase in absorbance at 240 nm at 16 mM GSH after mixing the enzyme with 17 μM CDNB. The solid line is the best fit to a single exponential to obtain kobs. (B) The dependence of kobs for GSH thiolate formation on GSH concentration was fitted to Eq. (3) (n = 2 at low GSH concentrations, n = 3 at 8 and 16 mM). Enzyme concentration used was 14 μM trimer as measured by an active site titration (not shown).
Fig. 6
Fig. 6
Inhibition of MGST1 by the product GSDNB. Lineweaver-Burk plot (A) and a fit of the data (B) to a mixed inhibition mechanism. The concentration of GSDNB was 0 (■), 20 (▲), 80 (▼), 500 (◆) and 750 (●) μM, GSH was varied between 0.5 and 15 mM and the CDNB concentration was fixed at 0.5 mM. The enzyme concentration was 0.5 μM trimer (n = 3).

References

    1. Rinaldi R, Eliasson E, Swedmark S, Morgenstern R. Drug Metab Dispos. 2002;30:1053–1058. - PubMed
    1. Busenlehner LS, Codreanu SG, Holm PJ, Bhakat P, Hebert H, Morgenstern R, Armstrong RN. Biochemistry. 2004;43:11145–11152. - PubMed
    1. Hebert H, Schmidt-Krey I, Morgenstern R, Murata K, Hirai T, Mitsuoka K, Fujiyoshi Y. J Mol Biol. 1997;271:751–758. - PubMed
    1. Holm PJ, Bhakat P, Jegerschöld C, Gyobu N, Mitsuoka K, Fujiyoshi Y, Morgenstern R, Hebert H. J Mol Biol. 2006;360:934–945. - PubMed
    1. Holm PJ, Morgenstern R, Hebert H. Biochim Biophys Acta. 2002;1594:276–285. - PubMed

Publication types

LinkOut - more resources