. 2009 May 12;106(19):7858-63.
doi: 10.1073/pnas.0901781106. Epub 2009 Apr 22.

Quantitative genome-scale analysis of protein localization in an asymmetric bacterium

Affiliations

Quantitative genome-scale analysis of protein localization in an asymmetric bacterium

John N Werner et al. Proc Natl Acad Sci U S A. .

Abstract

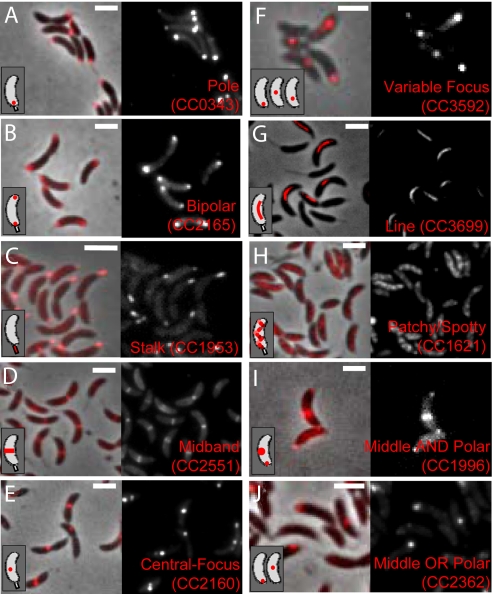
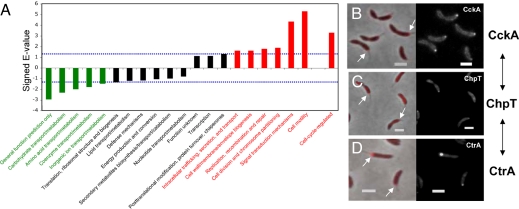
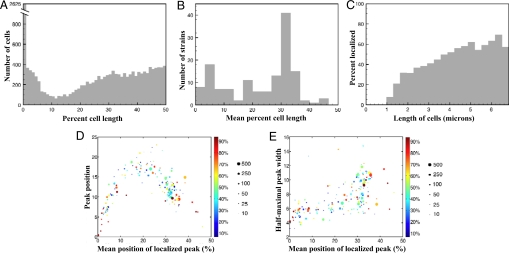
Despite the importance of subcellular localization for cellular activities, the lack of high-throughput, high-resolution imaging and quantitation methodologies has limited genomic localization analysis to a small number of archival studies focused on C-terminal fluorescent protein fusions. Here, we develop a high-throughput pipeline for generating, imaging, and quantitating fluorescent protein fusions that we use for the quantitative genomic assessment of the distributions of both N- and C-terminal fluorescent protein fusions. We identify nearly 300 localized Caulobacter crescentus proteins, up to 10-fold more than were previously characterized. The localized proteins tend to be involved in spatially or temporally dynamic processes and proteins that function together and often localize together as well. The distributions of the localized proteins were quantitated by using our recently described projected system of internal coordinates from interpolated contours (PSICIC) image analysis toolkit, leading to the identification of cellular regions that are over- or under-enriched in localized proteins and of potential differences in the mechanisms that target proteins to different subcellular destinations. The Caulobacter localizome data thus represent a resource for studying both global properties of protein localization and specific protein functions, whereas the localization analysis pipeline is a methodological resource that can be readily applied to other systems.


Conflict of interest statement

The authors declare no conflict of interest.

Figures

Fig. 1.
Fig. 1.
Representative images of the different classes of Caulobacter protein localizations. (A–J) For each class, an overlay of phase contrast and mCherry fluorescence images is shown on the Left, the fluorescence image alone is shown on the Right, and a schematic representation is shown in the Inset. (Scale bars represent 2 μm.)
Fig. 2.
Fig. 2.
Functions of localized Caulobacter proteins. (A) The enrichment of localized proteins was examined for each of the 21 GO-term functional subcategories and for a previously generated list of genes whose transcripts are cell-cycle-regulated (20). The dotted blue lines represent a P = 0.05 significance threshold. The names and values of over-enriched categories are shown in red and the under-enriched categories are shown in green. (B–D) The CckA, ChpT, and CtrA proteins that function together also localize together in Caulobacter. For each protein, an overlay of phase contrast and mCherry fluorescence images is shown on the Left and the fluorescence image alone is shown on the Right. Arrows point to fluorescent foci found at the stalked pole. (Scale bars represent 2 μm.)
Fig. 3.
Fig. 3.
Quantitative analysis of fluorescent protein localization. (A) A histogram of the location of the fluorescent peak in individual cells, broken into 1% bins, shows high enrichment for polar localization and a region, between ≈5% and 20% of the cell length, where the focus is relatively rarely found. (B) A histogram of the mean position of localization for each strain, broken into 3.3% bins, shows enrichment for localization near the pole and at ≈1/3 the cell length (only strains with >30 cells exhibiting a fluorescent focus are shown). (C) The frequency of a cell displaying localization increases with cell length. (D) Strains exhibiting localization patterns near the pole or midcell have tighter distributions of localization than those at the midcell. The x axis is the mean position of each localized peak as a percentage of cell length. The y axis is the standard deviation of each peak position as a percentage of cell length. Each point represents a single strain, point size represents the number of localized cells present, and point color represents the percentage of cells in that strain exhibiting localization. (E) The mean diffuseness of the localized focus increases as the mean localization moves toward the midcell, with a large jump nearest midcell. The x axis is the mean position of each localized peak as a percentage of cell length. The y axis is the mean half-maximal width of each peak as a percentage of cell length. Point size and color as in D.

References

    1. Huh WK, et al. Global analysis of protein localization in budding yeast. Nature. 2003;425:686–691. - PubMed
    1. Kitagawa M, et al. Complete set of ORF clones of Escherichia coli ASKA library (a complete set of E. coli K-12 ORF archive): Unique resources for biological research. DNA Res. 2005;12:291–299. - PubMed
    1. Matsuyama A, et al. ORFeome cloning and global analysis of protein localization in the fission yeast Schizosaccharomyces pombe. Nat Biotechnol. 2006;24:841–847. - PubMed
    1. Gitai Z. The new bacterial cell biology: Moving parts and subcellular architecture. Cell. 2005;120:577–586. - PubMed
    1. Collier J, Shapiro L. Spatial complexity and control of a bacterial cell cycle. Curr Opin Biotechnol. 2007;18:333–340. - PMC - PubMed

Publication types

MeSH terms

LinkOut - more resources