. 2009 May 12;106(19):7828-33.
doi: 10.1073/pnas.0812227106. Epub 2009 Apr 28.

Experimental characterization of disordered and ordered aggregates populated during the process of amyloid fibril formation

Affiliations

Experimental characterization of disordered and ordered aggregates populated during the process of amyloid fibril formation

Natàlia Carulla et al. Proc Natl Acad Sci U S A. .

Abstract

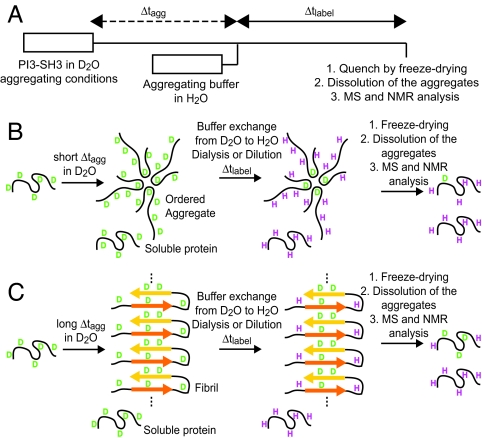
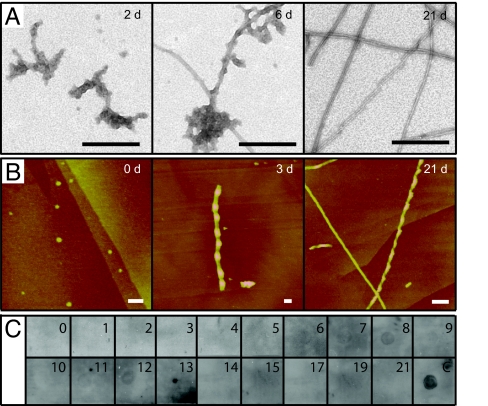
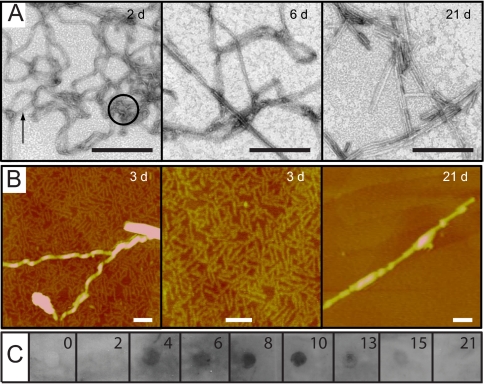
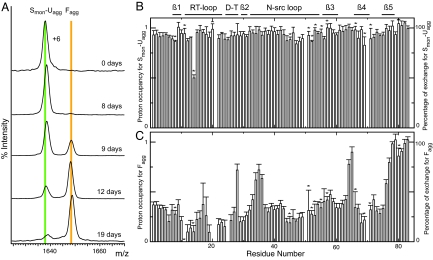
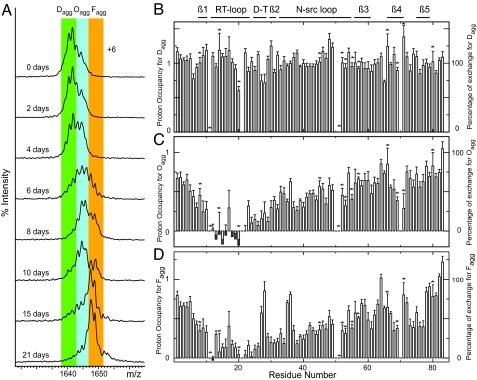
Recent experimental evidence points to intermediates populated during the process of amyloid fibril formation as the toxic moieties primarily responsible for the development of increasingly common disorders such as Alzheimer's disease and type II diabetes. We describe here the application of a pulse-labeling hydrogen-deuterium (HD) exchange strategy monitored by mass spectrometry (MS) and NMR spectroscopy (NMR) to characterize the aggregation process of an SH3 domain under 2 different conditions, both of which ultimately lead to well-defined amyloid fibrils. Under one condition, the intermediates appear to be largely amorphous in nature, whereas under the other condition protofibrillar species are clearly evident. Under the conditions favoring amorphous-like intermediates, only species having no protection against HD exchange can be detected in addition to the mature fibrils that show a high degree of protection. By contrast, under the conditions favoring protofibrillar-like intermediates, MS reveals that multiple species are present with different degrees of HD exchange protection, indicating that aggregation occurs initially through relatively disordered species that subsequently evolve to form ordered aggregates that eventually lead to amyloid fibrils. Further analysis using NMR provides residue-specific information on the structural reorganizations that take place during aggregation, as well as on the time scales by which they occur.


Conflict of interest statement

The authors declare no conflict of interest.

Figures

Fig. 1.
Fig. 1.
Schematic description of the pulse-labeling HD exchange experiment developed to study protein aggregation. (A) The experiment starts by incubating soluble protein under aggregation conditions in a deuterium based buffer. After a variable aggregation time, Δtagg, labeling takes place for a fixed period, Δtlabel, using protonated aggregation buffer. The magnitude of Δtlabel is chosen so that only unprotected amide deuterons will exchange significantly with the solvent. After the labeling pulse, freeze-drying is used to quench exchange. Different samples are prepared at defined Δtagg values, which are later solubilized into monomers by transfer to a DMSO solution and analyzed by NMR and ESI-MS. The figure illustrates hypothetical scenarios when the protein is left to aggregate for a short Δtagg (B) and a long Δtagg (C).
Fig. 2.
Fig. 2.
Characterization of the PI3-SH3 aggregation process under AM conditions. (A) Electron micrographs obtained for Δtagg of 2, 6, and 21 days. (Scale bar, 200 nm.) (B) AFM images obtained for Δtagg of 0, 3, and 21 days. (Scale bar, 100 nm.) (C) Kinetics of oligomer-specific immunoreactivity. At the times indicated, aliquots were applied to a nitrocellulose membrane and probed with the oligomer-specific antibody, A11. The spot marked with a C corresponds to Aβ oligomers and was used as a positive control.
Fig. 3.
Fig. 3.
Characterization of the PI3-SH3 aggregation process under PF conditions. (A) Electron micrographs obtained for Δtagg of 2, 6, and 21 days. The circle indicates a protofibril and the arrow shows a flat-ribbon-like fibril. (Scale bar, 200 nm.) (B) AFM images obtained for Δtagg of 3 and 21 days. (Scale bar, 100 nm.) (C) Kinetics of oligomer-specific immunoreactivity. At the times indicated, aliquots were applied to a nitrocellulose membrane and probed with the oligomer-specific antibody, A11.
Fig. 4.
Fig. 4.
PI3-SH3 pulse-labeled samples prepared under AM conditions. (A) ESI-MS mass spectra (+6 charge state). The spectra show the relative populations of Smon-Uagg and Fagg at the indicated Δtagg times. Peak intensities are normalized to the overall species population. (B) Exchange profile for Smon-Uagg obtained from NMR data of samples prepared after Δtagg of 8 days. (C) Exchange profile for Fagg obtained by deconvolution of the NMR data of samples prepared after Δtagg values of 10, 11, 12, 13, 17, and 19 days by using the distribution of populations obtained by ESI-MS analysis and the NMR exchange profile for the Smon-Uagg species. (B and C) The bars represent the proton occupancy and percentage of exchange for each residue. The locations of the β-sheet strands, turns, and loops in the native state of PI3-SH3 are indicated above the graph. An asterisk above a bar indicates a residue whose resonance is not fully resolved; the absence of a bar indicates that the resonance of the residue is not detectable or that the residue is proline that does not have an amide hydrogen (residues 50, 70, and 84).
Fig. 5.
Fig. 5.
PI3-SH3 pulse-labeled samples prepared under PF conditions. (A) ESI-MS mass spectra (+6 charge state). The spectra show the relative populations of Dagg (green band), Oagg (blue band), and Fagg (orange band) at the indicated Δtagg times. Peak intensities are normalized to the overall species population. (B–D) Exchange profile for Dagg (B), Oagg (C), and Fagg (D). These profiles were obtained by multilinear regression analysis combining the NMR data of samples prepared after Δtagg equal to 0, 2, 6, 10, 13, and 15 days and the distribution of populations obtained by ESI-MS. The bars represent the proton occupancy and percentage of exchange for each residue. The locations of the β-sheet strands, turns, and loops in the native state of PI3-SH3 are indicated above the graph. An asterisk above a bar indicates a residue whose resonance is not fully resolved; the absence of a bar indicates that the resonance of the residue is not detectable or that the residue is proline that does not have an amide hydrogen (residues 50, 70, and 84).

References

    1. Selkoe DJ. Folding proteins in fatal ways. Nature. 2003;426:900–904. - PubMed
    1. Chiti F, Dobson CM. Protein misfolding, functional amyloid, and human disease. Annu Rev Biochem. 2006;75:333–366. - PubMed
    1. Rochet JC, Lansbury PT., Jr Amyloid fibrillogenesis: Themes and variations. Curr Opin Struct Biol. 2000;10:60–68. - PubMed
    1. Cleary JP, et al. Natural oligomers of the amyloid-beta protein specifically disrupt cognitive function. Nat Neurosci. 2005;8:79–84. - PubMed
    1. Haass C, Selkoe DJ. Soluble protein oligomers in neurodegeneration: Lessons from the Alzheimer's amyloid beta-peptide. Nat Rev Mol Cell Biol. 2007;8:101–112. - PubMed

Publication types