

Longitudinal progression of Alzheimer's-like patterns of atrophy in normal older adults: the SPARE-AD index
- PMID: 19416949
- PMCID: PMC2714059
- DOI: 10.1093/brain/awp091
Longitudinal progression of Alzheimer's-like patterns of atrophy in normal older adults: the SPARE-AD index
Abstract
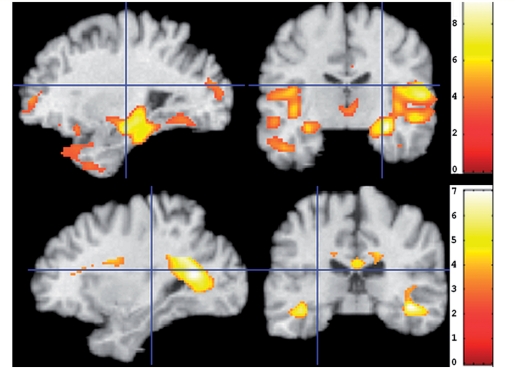
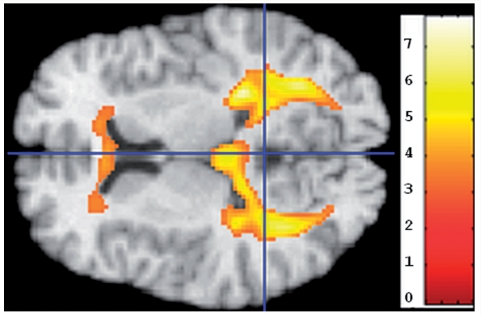
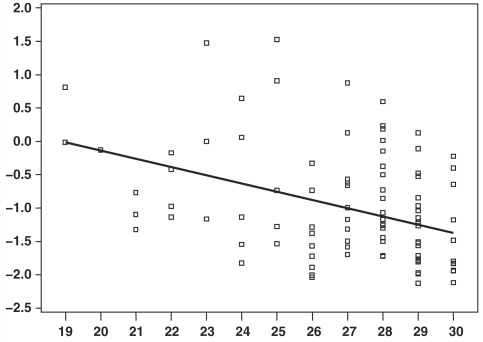
A challenge in developing informative neuroimaging biomarkers for early diagnosis of Alzheimer's disease is the need to identify biomarkers that are evident before the onset of clinical symptoms, and which have sufficient sensitivity and specificity on an individual patient basis. Recent literature suggests that spatial patterns of brain atrophy discriminate amongst Alzheimer's disease, mild cognitive impairment (MCI) and cognitively normal (CN) older adults with high accuracy on an individual basis, thereby offering promise that subtle brain changes can be detected during prodromal Alzheimer's disease stages. Here, we investigate whether these spatial patterns of brain atrophy can be detected in CN and MCI individuals and whether they are associated with cognitive decline. Images from the Alzheimer's Disease Neuroimaging Initiative (ADNI) were used to construct a pattern classifier that recognizes spatial patterns of brain atrophy which best distinguish Alzheimer's disease patients from CN on an individual person basis. This classifier was subsequently applied to longitudinal magnetic resonance imaging scans of CN and MCI participants in the Baltimore Longitudinal Study of Aging (BLSA) neuroimaging study. The degree to which Alzheimer's disease-like patterns were present in CN and MCI subjects was evaluated longitudinally in relation to cognitive performance. The oldest BLSA CN individuals showed progressively increasing Alzheimer's disease-like patterns of atrophy, and individuals with these patterns had reduced cognitive performance. MCI was associated with steeper longitudinal increases of Alzheimer's disease-like patterns of atrophy, which separated them from CN (receiver operating characteristic area under the curve equal to 0.89). Our results suggest that imaging-based spatial patterns of brain atrophy of Alzheimer's disease, evaluated with sophisticated pattern analysis and recognition methods, may be useful in discriminating among CN individuals who are likely to be stable versus those who will show cognitive decline. Future prospective studies will elucidate the temporal dynamics of spatial atrophy patterns and the emergence of clinical symptoms.
Figures


References
-
- Benton A. Revised Visual Retention Test. New York: Psychological Corporation; 1974.
-
- Beresford T, Arciniegas D, Alfers J, Clapp L, Martin B, Beresford H, et al. Hypercortisolism in alcohol dependence and its relation to hippocampal volume loss. J Stud Alcohol. 2006a;67:861–7. - PubMed
-
- Beresford TP, Arciniegas DB, Alfers J, Clapp L, Martin B, Du Y, et al. Hippocampus volume loss due to chronic heavy drinking. Alcohol Clin Exp Res. 2006b;30:1866–70. - PubMed
-
- Blessed G, Tomlinson B, Roth M. The association between quantitative measures of dementia and of senile change in the cerebral grey matter of elderly subjects. Br J Psychiatry. 1968;114:797–811. - PubMed
Publication types
MeSH terms
Grants and funding
LinkOut - more resources
Full Text Sources
Other Literature Sources
Medical
