. 2009 Jul 10;284(28):18715-25.
doi: 10.1074/jbc.M109.015099. Epub 2009 May 5.

The C terminus of Na+,K+-ATPase controls Na+ affinity on both sides of the membrane through Arg935

Affiliations

The C terminus of Na+,K+-ATPase controls Na+ affinity on both sides of the membrane through Arg935

Mads S Toustrup-Jensen et al. J Biol Chem. .

Abstract

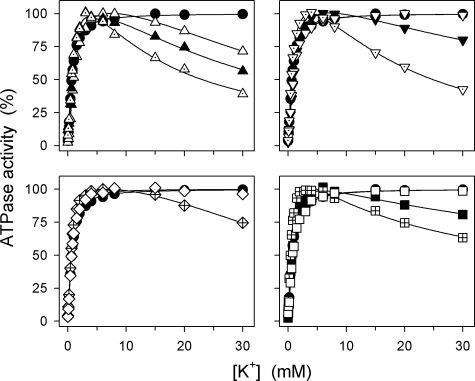
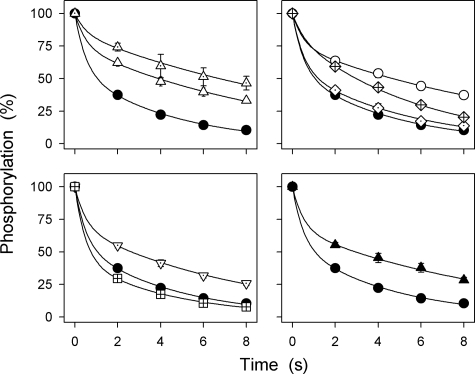
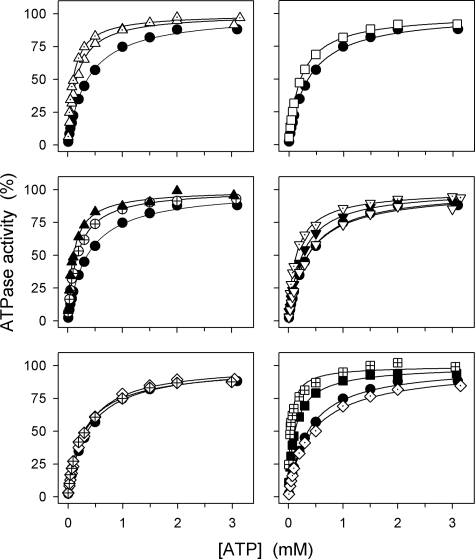
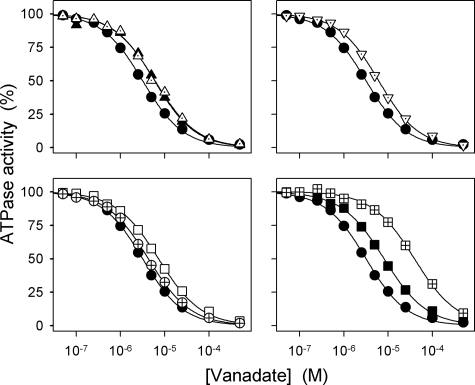
The Na(+),K(+)-ATPase C terminus has a unique location between transmembrane segments, appearing to participate in a network of interactions. We have examined the functional consequences of amino acid substitutions in this region and deletions of the C terminus of varying lengths. Assays revealing separately the mutational effects on internally and externally facing Na(+) sites, as well as E(1)-E(2) conformational changes, have been applied. The results pinpoint the two terminal tyrosines, Tyr(1017) and Tyr(1018), as well as putative interaction partners, Arg(935) in the loop between transmembrane segments M8 and M9 and Lys(768) in transmembrane segment M5, as crucial to Na(+) activation of phosphorylation of E(1), a partial reaction reflecting Na(+) interaction on the cytoplasmic side of the membrane. Tyr(1017), Tyr(1018), and Arg(935) are furthermore indispensable to Na(+) interaction on the extracellular side of the membrane, as revealed by inability of high Na(+) concentrations to drive the transition from E(1)P to E(2)P backwards toward E(1)P and inhibit Na(+)-ATPase activity in mutants. Lys(768) is not important for Na(+) binding from the external side of the membrane but is involved in stabilization of the E(2) form. These data demonstrate that the C terminus controls Na(+) affinity on both sides of the membrane and suggest that Arg(935) constitutes an important link between the C terminus and the third Na(+) site, involving an arginine-pi stacking interaction between Arg(935) and the C-terminal tyrosines. Lys(768) may interact preferentially with the C terminus in E(1) and E(1)P forms and with the loop between transmembrane segments M6 and M7 in E(2) and E(2)P forms.


Figures

SCHEME 1.
SCHEME 1.
Model for the reaction cycle of the Na+,K+-ATPase (Post-Albers model). Occluded ions are shown in brackets. The cytoplasmic and extracellular ions binding at transport sites are indicated by the subscript c and e, respectively. ATP binding with low affinity is shown boxed.
FIGURE 1.
FIGURE 1.
Structural features of the C terminus in the crystallized [K2]E2MgF form of the Na+,K+-ATPase. The structure has Protein Data Bank (PDB) code 3B8E (4). The main chain of the α-subunit is gray, the β-subunit (membrane segment βM shown) is purple, and the γ-subunit (membrane segment γM shown) is red. Pink spheres indicate the two Rb+ ions bound at the K+ sites. Side chains of most of the residues considered in the present study are highlighted as sticks. Carbon atoms are indicated in gray, oxygen atoms in red, and nitrogen atoms in blue. Dotted lines indicate putative hydrogen bonds and salt links. A, overview of the structure, cytoplasmic side up. The blue mesh shows a 2FoFc electron density map contoured at 1σ to cover the C-terminal residues. B, stereo view of the same electron density map of the C terminus as in A seen from the cytoplasmic side of the membrane. C, view from the cytoplasmic side of the membrane, showing details of the C terminus and its binding pocket as well as the putative third Na+ binding site comprised by Tyr773, Glu956, and Gln925. Residues highlighted as sticks are labeled with numbers according to the rat α1-sequence. In addition, transmembrane helices M3, M5, M6, M7, M8, M9, and M10 and cytoplasmic loops L6–7 and L8–9 are labeled. D, side view along the membrane surface of the same details as in C.
FIGURE 2.
FIGURE 2.
K+ dependence of Na+,K+-ATPase activity. Measurements were performed at 37 °C in 30 mm histidine (pH 7.4), 40 mm NaCl, 3 mm ATP, 3 mm MgCl2, 1 mm EGTA, 10 μm ouabain, and the indicated concentrations of K+ added as KCl. Filled circle, wild type; open triangle pointing upward, ΔYY; filled triangle pointing upward, ΔTYY; dotted triangle pointing upward, ΔWVEKETYY; open triangle pointing downward, Y1018F; filled triangle pointing downward, Y1018A; dotted triangle pointing downward, YY-AA; open diamond, R936A; crossed diamond, R935A; open square, EKE-AAA; filled square, K768M; crossed square, K768A. For comparison, the wild type is shown in all panels. The K0.5(K+) values for the activating phase are indicated in Table 1.
FIGURE 3.
FIGURE 3.
Na+ dependence of phosphorylation by ATP. Phosphorylation was carried out for 10 s at 0 °C in 20 mm Tris (pH 7.5), 3 mm MgCl2, 2 μm [γ-32P]ATP, 10 μm ouabain, 20 μg/ml oligomycin, and the indicated concentrations of Na+ added as NaCl with varying amounts of N-methyl-d-glucamine to maintain the ionic strength. Filled circle, wild type; crossed circle, ΔY; open triangle pointing upward, ΔYY; filled triangle pointing upward, ΔTYY; dotted triangle pointing upward, ΔWVEKETYY; dotted triangle pointing downward, YY-AA; dotted circle, Y1017F; open triangle pointing downward, Y1018F; dotted square, Y1017A; filled triangle pointing downward, Y1018A; open square, EKE-AAA; open diamond, R936A; crossed diamond, R935A; dotted diamond, GG-AA; filled square, K768M; crossed square, K768A. For comparison, the wild type is shown in all panels. Each line shows the best fit of the Hill equation, and the extracted K0.5(Na+) values are indicated in Table 1.
FIGURE 4.
FIGURE 4.
Phosphorylation levels at 150 mm and 600 mm Na+ relative to the maximum level obtained in the presence of oligomycin. Phosphorylation was carried out for 10 s at 0 °C in 20 mm Tris (pH 7.5), 3 mm MgCl2, 1 mm EGTA, 10 μm ouabain, 2 μm [γ-32P]ATP, and 150 (black columns) or 600 (gray columns) mm NaCl. The phosphorylation level is shown relative to that obtained at 150 mm NaCl in the presence of oligomycin (20 μg/ml). Standard errors are indicated by error bars. WT, wild type.
FIGURE 5.
FIGURE 5.
Distribution of phosphoenzyme between E1P and E2P intermediates at 150 mm Na+. Phosphorylation was carried out for 10 s at 0 °C in 20 mm Tris (pH 7.5), 150 mm NaCl, 3 mm MgCl2, 1 mm EGTA, 2 μm [γ-32P]ATP, and 10 μm ouabain. Dephosphorylation was followed at 0 °C upon the addition of 2.5 mm ADP and 1 mm ATP. A biexponential function was fitted to the data, and the extent of the slow component, corresponding to the fraction of phosphoenzyme that is ADP-insensitive E2P is indicated in Table 1 (E2P). Filled circle, wild type; dotted triangle pointing upward, ΔWVEKETYY; open triangle pointing upward, ΔYY; open circle, ΔKETYY; crossed diamond, R935A; dotted diamond, GG-AA; dotted triangle pointing downward, YY-AA; crossed square, K768A; filled triangle pointing upward, ΔTYY. Standard errors are shown by error bars where larger than the size of the symbols.
FIGURE 6.
FIGURE 6.
Dephosphorylation with (filled symbols) and without (open symbols) ADP at 600 mm Na+. Phosphorylation was carried out for 10 s at 0 °C in 20 mm Tris (pH 7.5), 150 mm NaCl, 3 mm MgCl2, 1 mm EGTA, 2 μm [γ-32P]ATP, and 10 μm ouabain. Dephosphorylation was followed at 0 °C upon the addition of NaCl to give a final Na+ concentration 600 mm and 1 mm ATP with 2.5 mm ADP (filled symbols) or 1 mm ATP without ADP (open symbols). The broken lines represent the wild-type data from the upper left panel. Standard errors are shown by error bars where larger than the size of the symbols.
FIGURE 7.
FIGURE 7.
Na+ dependence of ATPase activity in the absence of K+. Na+-ATPase activity was measured at 37 °C in 30 mm histidine (pH 7.4), 3 mm ATP, 3 mm MgCl2, 1 mm EGTA, 10 μm ouabain, and the indicated concentrations of Na+ added as NaCl. The molecular ATP hydrolysis activity (catalytic turnover rate) was calculated as the ratio between the specific ATPase activity and the active site concentration. Standard errors are shown by error bars where larger than the size of the symbols.
FIGURE 8.
FIGURE 8.
ATP dependence of Na+,K+-ATPase activity. The rate of ATP hydrolysis was determined at 37 °C in 30 mm histidine (pH 7.4), 130 mm NaCl, 20 mm KCl, 3 mm MgCl2, 1 mm EGTA, 10 μm ouabain, and the indicated concentrations of ATP. Filled circle, wild type; crossed circle, ΔY; open triangle pointing upward, ΔYY; filled triangle pointing upward, ΔTYY; dotted triangle pointing upward, ΔWVEKETYY; filled triangle pointing downward, Y1018A; dotted triangle pointing downward, YY-AA; open triangle pointing downward, Y1018F; open square, EKE-AAA; open diamond, R936A; crossed diamond, R935A; crossed square, K768A; filled square, K768M; dotted diamond, GG-AA. For comparison, the wild type is shown in all panels. Each line shows the best fit of the Hill equation, and the extracted K0.5(ATP) values are indicated in Table 1.
FIGURE 9.
FIGURE 9.
Vanadate dependence of Na+,K+-ATPase activity. The rate of ATP hydrolysis was determined at 37 °C in 30 mm histidine (pH 7.4), 130 mm NaCl, 20 mm KCl, 3 mm MgCl2, 3 mm ATP, 1 mm EGTA, 10 μm ouabain, and the indicated concentrations of vanadate. Filled circle, wild type; crossed circle, ΔY; filled triangle pointing upward, ΔTYY; dotted triangle pointing upward, ΔWVEKETYY; open square, EKE-AAA; crossed square, K768A; filled square, K768M; dotted triangle pointing downward, YY-AA. Each line shows the best fit of the Hill equation, and the extracted K0.5(vanadate) values for vanadate inhibition are indicated in Table 1.

References

    1. Glynn I. M. (1993) J. Physiol. 462, 1–30 - PMC - PubMed
    1. Kaplan J. H. (2002) Annu. Rev. Biochem. 71, 511–535 - PubMed
    1. Post R. L., Hegyvary C., Kume S. (1972) J. Biol. Chem. 247, 6530–6540 - PubMed
    1. Morth J. P., Pedersen B. P., Toustrup-Jensen M. S., Sørensen T. L., Petersen J., Andersen J. P., Vilsen B., Nissen P. (2007) Nature 450, 1043–1049 - PubMed
    1. Toyoshima C., Nakasako M., Nomura H., Ogawa H. (2000) Nature 405, 647–655 - PubMed

Publication types