. 2009 May;21(5):1473-94.
doi: 10.1105/tpc.108.065391. Epub 2009 May 5.

The ethylene receptor ETR2 delays floral transition and affects starch accumulation in rice

Affiliations

The ethylene receptor ETR2 delays floral transition and affects starch accumulation in rice

Hada Wuriyanghan et al. Plant Cell. 2009 May.

Abstract

Ethylene regulates multiple aspects of plant growth and development in dicotyledonous plants; however, its roles in monocotyledonous plants are poorly known. Here, we characterized a subfamily II ethylene receptor, ETHYLENE RESPONSE2 (ETR2), in rice (Oryza sativa). The ETR2 receptor with a diverged His kinase domain is a Ser/Thr kinase, but not a His kinase, and can phosphorylate its receiver domain. Mutation of the N box of the kinase domain abolished the kinase activity of ETR2. Overexpression of ETR2 in transgenic rice plants reduced ethylene sensitivity and delayed floral transition. Conversely, RNA interference (RNAi) plants exhibited early flowering and the ETR2 T-DNA insertion mutant etr2 showed enhanced ethylene sensitivity and early flowering. The effective panicles and seed-setting rate were reduced in the ETR2-overexpressing plants, while thousand-seed weight was substantially enhanced in both the ETR2-RNAi plants and the etr2 mutant compared with controls. Starch granules accumulated in the internodes of the ETR2-overexpressing plants, but not in the etr2 mutant. The GIGANTEA and TERMINAL FLOWER1/CENTRORADIALIS homolog (RCN1) that cause delayed flowering were upregulated in ETR2-overexpressing plants but downregulated in the etr2 mutant. Conversely, the alpha-amylase gene RAmy3D was suppressed in ETR2-overexpressing plants but enhanced in the etr2 mutant. Thus, ETR2 may delay flowering and cause starch accumulation in stems by regulating downstream genes.


Figures

Figure 1.
Figure 1.
Structural Features of Rice ETR2 and Alignment of the Amino Acid Sequence of the Kinase Domain with That of Other Ethylene Receptors. (A) Schematic representation of the rice ETR2 structure. The first box (gray) indicates a putative signal peptide. The next three boxes (black) indicate putative transmembrane domains. The GAF domain, the kinase domain, including the HIS and ATP subdomains, and the RD domain are also indicated. (B) Alignment of the amino acid sequences of the ethylene receptor kinase domains of various ethylene recpetors. The positions of the H, N, G1, F, and G2 box are indicated on top of the sequence based on the corresponding boxes from Arabidopsis ETR1. The amino acids shaded in black are identical to each other. Five mutated amino acids (G to A, E to Q, R to Q, F to A, and G to A) upstream of and within the N box are also indicated, and the mutated protein N was used for kinase analysis in Figure 2. At ETR1, At ETR2, and At EIN4 are from Arabidopsis. NTHK1 and NTHK2 are from tobacco. Zm ETR2 is from maize. The Os ETR2/Os PK1, Os ETR3/Os PK2, and Os ETR4/Os PK3 receptors are from rice.
Figure 2.
Figure 2.
Phosphorylation Assay of the ETR2 Protein. (A) Various truncated versions of the ETR2 protein expressed in bacteria. The full-length ETR2 protein was placed on the top for comparison. The N harbors mutations of five amino acids near the N box in the subdomain ATP-mN. GST was used as an affinity tag. (B) Purification of the truncated versions of the ETR2 GST-fusion protein. A common protein band (∼50 kD) was noted in the wild-type, N, and ΔATP protein preparations, and this band represented a degradation product of their original proteins, as established by Matrix Assisted Laser Desorption/Ionization Time-of-Flight (MALDI-TOF) Mass Spectrometry analysis. The GST protein and the commercial MBP protein were also included for comparisons. Proteins were separated by SDS-PAGE and stained with Coomassie blue. (C) Autophosphorylation of the ETR2 kinase domain. The GST-fusion wild type was incubated with [γ-32P]ATP in the presence of 5 mM Mn2+, 5 mM Mg2+, or 5 mM Ca2+. Phosphorylated proteins were separated by SDS-PAGE, transferred onto a PVDF membrane, and autoradiographed (top) or stained with Coomassie blue (bottom). (D) Autophosphorylation assay of various domains of ETR2. Assays were performed in the presence of 5 mM Mn2+. Other procedures are the same as those in (C). (E) Hydrolytic stability of the phosphorylated ETR2. The wild type was autophosphorylated in the presence of Mn2+ and then the phosphorylated wild type was subjected to treatments with water, HCl, or NaOH. (F) Phosphoamino acid analysis of the phosphorylated ETR2. The positions of the phosphoamino acids were identified by spraying with ninhydrin (left), and the labeled residues (pSer, pThr, and pTyr) were revealed by autoradiography (right). (G) Mutation and substrate analysis of the ETR2 kinase domain. The wild-type or N mutant was incubated under phosphorylating conditions with RD or MBP. After separation by SDS-PAGE, the phosphorylated proteins were subjected to autoradiography (top) or Coomassie blue staining (bottom). Numbers on the left indicate the sizes of the protein markers (kD) for (C), (D), and (G).
Figure 3.
Figure 3.
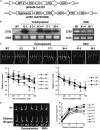
Ethylene Sensitivity of ETR2 Transgenic Rice Plants. (A) Constructs used for rice transformation. Overexpression of the ETR2 gene (top) and RNAi inhibition of ETR2 (bottom). (B) ETR2 gene expression in overexpressing plants and RNAi plants. In the left panel, overexpression was revealed by RNA gel blot analysis. In the right panel, RT-PCR analysis was performed and the actin gene was amplified as a control; one of three consistent biological replicates is shown. The 8-2−/− and the 8-2+/+ represent T2 segregated wild-type and homozygous ETR2 transgenic plants, respectively, from seeds of the heterozygous T1 plants. All other lines are T2 homozygous lines. WT indicates control TP309. (C) Response of etiolated transgenic rice seedlings to ACC treatment. In each of the top row of panels, 3-d-old seedlings were treated with ACC at concentrations of 0, 0.01, 0.1, 1, 10, and 100 μM (from left to right), respectively for 7 d. T3 seeds were used for the assay. The bottom part indicates relative root growth upon ACC treatment. The root length of the corresponding seedlings at zero point (3-d-old seedlings were further grown in water for 7 d) was set to 1, and all the other values were compared with it. Each data point represents the average of 15 to ∼20 seedlings, and bars indicate sd. Only one sd was shown for simplicity. The left panel is for overexpressing lines, and the difference between the four overexpressing lines and the wild type is significant (P < 0.05) at 1, 10, and 100 μM. At 0.1 μM, the 8-2 and 17-1 points are also significantly different from the wild type (P < 0.05). The right panel is for RNAi lines. Bars = 4 cm. (D) Coleoptile growth of the transgenic rice seedlings under ethylene treatment. The photograph on the left was taken 3 d after seed germination in the dark at 25°C with 50 ppm ethylene treatment. The right panel indicates coleoptile growth in response to ethylene. Each data point represents the average of 15 to ∼20 seedlings. Among all the data points, the largest standard error was 0.55, and these are not shown for simplicity. The difference in coleoptile length between the wild type and the four overexpressing lines is significant (P < 0.05) at 50 ppm.
Figure 4.
Figure 4.
Phenotype of the ETR2-Overexpressing Plants and the RNAi Lines. (A) Seedling length of the ETR2-overexpressing lines (8-2, 12-1, 17-1, and 56-4) and the RNAi lines (41-4 and 66-1). T3 seeds were germinated and grown on wet cheesecloth for different periods of time, and the shoot length was measured. Each data point represents an average of 15 to 20 seedlings, and bars indicate sd. (B) Shoot length of the transgenic seedlings grown in soil seed bed for 50 d. Top panel: phenotype of the transgenic seedlings. Bar = 5 cm. Bottom panel: comparison of the seedling lengths. The data are averages of 15 to 20 seedlings, and bars indicate sd. (C) Comparison of the panicle development in various transgenic lines. The 100-d-old plants grown in the field were peeled, and the young panicles or the SAM tissue was photographed and compared. Bars = 10 cm. (D) Heading time distributions of the transgenic rice plants grown in the field. During the heading period, the number of heading plants for each line was recorded each day and compared. (E) Phenotypic comparison of the transgenic plants during the heading period. The rice plants had been grown in the field for 139 d. The plants from the transgenic lines and the wild type were carefully pulled out from the field and regrown in pots for photographing. Bar = 20 cm. (F) Internode length of the transgenic rice plants in comparison with the control plants. From top to bottom, four internodes were measured before harvest. Each data point represents the average of 15 to 20 plants, and bars indicate sd. (G) Comparison of plant height. Measurements were performed before harvest, and the data are an average of 30 plants. Bars indicate sd. For all the data, one asterisk indicates significant difference (P < 0.05), and two asterisks indicate extremely significant difference (P < 0.01) in comparison with the control value.
Figure 5.
Figure 5.
Yield-Related Traits of the ETR2-Overexpressing Rice Plants and the RNAi Plants in Comparison with the Control. (A) Panicle morphology of transgenic plants. The plants were grown in the field for 157 d. (B) Comparison of yield-related traits in transgenic plants and control plants. In the top panel, the effective tillers (ratio of the tillers having panicles to all the tillers) was compared. In the middle panel, the effective panicles (ratio of the panicles having at least one full-sized grain at maturity to all the panicles) was compared. Seed-setting rate in the different lines was compared in the bottom panel. (C) Seed-setting rate of the severe ETR2-overexpressing line 12-1 in comparison with the control plants. WT1 indicates a normal control, whereas the WT2 indicates an 18-d-old late-grown control. The WT1 was sown at the same time as the 12-1 line, whereas the WT2 had the same heading date as the 12-1 line. (D) Seed phenotype at harvest from various transgenic lines. (E) Comparison of the thousand-seed weight from various transgenic lines. The two sets of data were from plants grown in Beijing and Hainan, respectively. Different letters above each column indicate significant difference (P < 0.05) between the two compared values. For all the data, each data point is derived from 30 individual plants, and bars indicate sd. One asterisk indicates significant difference (P < 0.05), and two asterisks indicate extremely significant difference (P < 0.01) in comparison with the corresponding wild-type value.
Figure 6.
Figure 6.
Starch Accumulation in the Internodes of the ETR2 Transgenic Plants. (A) Number of starch granules in the ETR2-overexpressing line 12-1, the RNAi line 41-4, and control plants that have identical growing time. All plants are at the ripening stage. For each line, four internodes from the top to bottom were cross-sectioned, and sections were examined for starch granules by scanning electron microscopy. Data are the average numbers from 30 cells. Bars indicate sd. (B) Scanning electron micrograph of the cross sections from the first internode of the ETR2-overexpressing plants, the RNAi plants, and the control plants. These plants are at the same developmental stage after heading but have different growing times. V indicates vascular tissue and an arrow indicates a starch granule. Bars = 40 μM. (C) The number of the starch granules in the transgenic and control plants that are at the same developmental stage after heading. Data are the average numbers from 30 cells as in the sections from (B). Bars indicate sd. (D) Iodine staining of starch granules from the first internode of the transgenic and control plants that are at the same developmental stage after heading but have different growing times. Other indications are the same as in (B). One asterisk indicates significant difference (P < 0.05), and two asteriaks indicate extremely significant difference (P < 0.01) in comparison with the corresponding wild-type value.
Figure 7.
Figure 7.
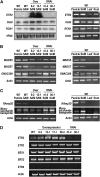
Altered Gene Expression in ETR2-Overexpressing Plants and RNAi Plants. (A) Genes upregulated by ETR2. Total RNAs were isolated from the SAM and other organs. In the left panel, total RNAs were subjected to RNA gel blot analysis using probes synthesized from the ETR2, OsGI, and RCN1 genes, respectively. The RNA loading was examined by ethidium bromide staining. “Over” indicates ETR2-overexpressing lines, and “RNAi” indicates the RNAi lines. In the right panel, the total RNAs from different organs of the control plants (WT) were subjected to RT-PCR analysis. The rice Actin gene was amplified as a control. (B) Genes downregulated by ETR2. RT-PCR was performed to examine the expression of the MADS5, MADS7, and ONAC300 genes in the transgenic and control plants. The Actin gene was amplified as a control. (C) The α-amylase gene and a monosaccharide transporter gene are downregulated by ETR2. The two genes were examined by RT-PCR in the transgenic and control plants. The Actin gene was amplified as a control. (D) Expression of the five ethylene receptor genes in ETR2-overexpressing plants and the RNAi plants. For all RT-PCR analyses, three biological replicates were performed, and the results were consistent. One set of the results is shown.
Figure 8.
Figure 8.
Identification of T-DNA Insertion Mutants and Their Ethylene Sensitivity. (A) Schematic representation of T-DNA insertions in ETR2, ETR3, and ERS2 genomic sequences and PCR identification of mutants. The etr2, etr3, and ers2 are mutant plants for ETR2, ETR3, and ERS2, respectively. ZH (Zhong Hua 11) is the parental control plant. ZH/etr3 and ZH/ers2 are heterozygous plants. p1 and p2 are primers from the T-DNA regions. The 5′- and 3′-primers are from the genes examined. ATG indicates the start codon. (B) Examination of ETR2, ETR3, and ERS2 expression in their corresponding mutants by RT-PCR. Actin was amplified as a control. Three biological replicates for RT-PCR were performed, and the results were consistent. One set of the results is shown. (C) Coleoptile growth of etr2, etr3, and ers2 in response to ethylene treatment. Left panel: phenotype of the etiolated seedlings after ethylene treatment. Right panel: coleoptile growth of various mutants after ethylene treatments. Each data point represents the average of 20 to 30 seedlings. Bars indicate sd.
Figure 9.
Figure 9.
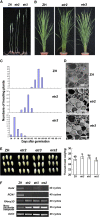
Phenotype of etr2 and etr3 Mutants in Comparison with the Control ZH (Zhong Hua 11). (A) Panicle development in mutants and the control line ZH. Tillers from field-grown rice plants (98 d) were peeled, and the two most developed panicles are shown. (B) Heading of mutants and control line ZH. Plants (100 d) were carefully pulled out from the field and regrown in pots for photography. (C) Heading time distribution of the mutants and control line ZH. During the heading period, the number of the heading plants for mutants and the control line grown in the field was recorded each day and analyzed. (D) Comparison of starch granules in cross sections from the first internode of mutants and control plants. Plants (119 d) during the grain-filling period were used for cross section and observation under a scanning electron microscope. Bars = 40 μM. (E) Comparison of seed phenotype (left panel) and thousand-seed weight (right panel). Seeds from etr2, etr3, ers2, and the control line ZH were compared. Different letters above each column indicate significant difference (P < 0.05) between the two compared values. (F) Altered gene expression in rice mutants and control line. The late-flowering gene OsGI and RCN1, α-amylase gene RAmy3D, and a monosaccharide transporter gene were examined by RT-PCR. Actin gene was amplified as a control. Three biological replicates for RT-PCR were performed and the results were consistent. One set of the results is shown.

References

    1. Abeles, F.B. (1967). Inhibition of flowering in Xanthium pensylvanicum Walln. by ethylene. Plant Physiol. 42 608–609. - PMC - PubMed
    1. Abeles, F.B., Morgan, P.W., and Saltveit, M.E., Jr. (1992). Ethylene in Plant Biology, 2nd ed. (San Diego, CA: Academic Press).
    1. Achard, P., Baghour, M., Chapple, A., Hedden, P., Van der Straeten, D., Genschik, P., Moritz, T., and Harberd, N.P. (2007). The plant stress hormone ethylene controls floral transition via DELLA-dependent regulation of floral meristem-identity genes. Proc. Natl. Acad. Sci. USA 104 6484–6489. - PMC - PubMed
    1. Aida, M., Ishida, T., and Tasaka, M. (1999). Shoot apical meristem and cotyledon formation during Arabidopsis embryogenesis, interaction among the CUP-SHAPED COYLEDON and SHOOT MERISTEMLESS genes. Development 126 1563–1570. - PubMed
    1. Aida, M., Ishida, T., Fukaki, H., Fujisawa, H., and Tasaka, M. (1997). Genes involved in organ separation in Arabidopsis: an analysis of cup-shaped cotyledon mutant. Plant Cell 9 841–857. - PMC - PubMed

Publication types

MeSH terms

LinkOut - more resources