. 2009 Aug 20;114(8):1545-52.
doi: 10.1182/blood-2009-03-206672. Epub 2009 May 5.

PD-1/PD-L1 interactions inhibit antitumor immune responses in a murine acute myeloid leukemia model

Affiliations

PD-1/PD-L1 interactions inhibit antitumor immune responses in a murine acute myeloid leukemia model

Long Zhang et al. Blood. .

Abstract

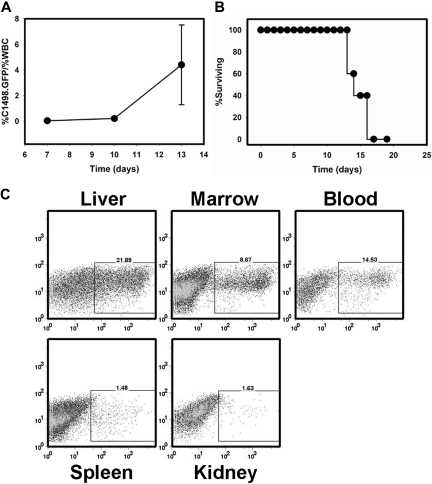
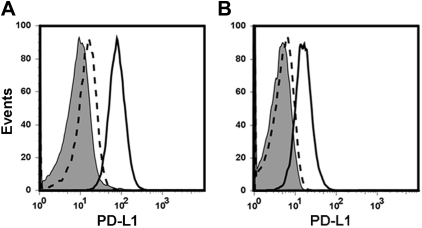
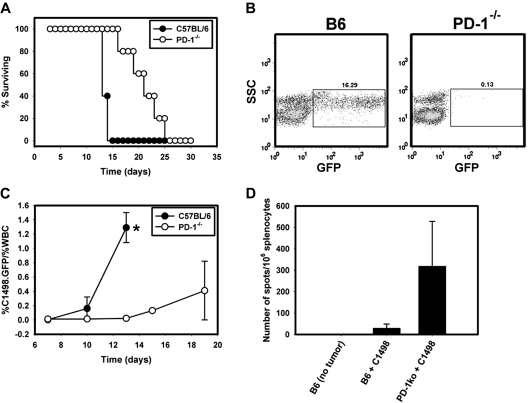
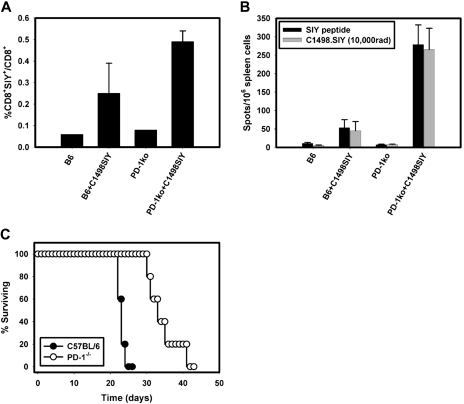
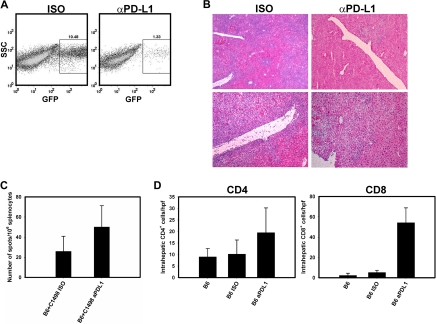
Negative regulatory mechanisms within the solid tumor microenvironment inhibit antitumor T-cell function, leading to evasion from immune attack. One inhibitory mechanism is up-regulation of programmed death-ligand 1 (PD-L1) expressed on tumor or stromal cells which binds to programmed death-1 (PD-1) on activated T cells. PD-1/PD-L1 engagement results in diminished antitumor T-cell responses and correlates with poor outcome in murine and human solid cancers. In contrast to available data in solid tumors, little is known regarding involvement of the PD-1/PD-L1 pathway in immune escape by hematopoietic cancers, such as acute myeloid leukemia (AML). To investigate this hypothesis, we used the murine leukemia, C1498. When transferred intravenously, C1498 cells grew progressively and apparently evaded immune destruction. Low levels of PD-L1 expression were found on C1498 cells grown in vitro. However, PD-L1 expression was up-regulated on C1498 cells when grown in vivo. PD-1(-/-) mice challenged with C1498 cells generated augmented antitumor T-cell responses, showed decreased AML burden in the blood and other organs, and survived significantly longer than did wild-type mice. Similar results were obtained with a PD-L1 blocking antibody. These data suggest the importance of the PD-1/PD-L1 pathway in immune evasion by a hematologic malignancy, providing a rationale for clinical trials targeting this pathway in leukemia patients.


Figures

Figure 1
Figure 1
C1498.GFP grows progressively when injected intravenously into immunocompetent, syngeneic mice. (A) C57BL/6 mice were injected with 106 C1498.GFP cells on day 0. On days 7, 10, and 13, peripheral blood was drawn from individual mice. Red blood cells were removed via exposure to ACK lysis buffer, and samples were analyzed by flow cytometry. The percentage of leukemia cells was calculated as percentage of GFP+ cells/percentage of total white blood cells. (B) Analysis of survival in a cohort of 5 C57BL/6 mice injected with C1498.GFP IV. Similar results were obtained in 2 independent experiments. (C) FACS analysis of organs from a C57BL/6 mouse 14 days after challenge with C1498.GFP.
Figure 2
Figure 2
PD-L1 is up-regulated on C1498.GFP after injection into wild-type mice. (A) C1498.GFP cells grown in vitro were analyzed for expression of PD-L1 by flow cytometry either at baseline or after in vitro exposure to IFN-γ for 48 hours. The shaded histogram represents staining with an isotype control antibody. The dashed line represents PD-L1 expression at baseline, and the solid line represents PD-L1 expression after exposure to IFN-γ. (B) C57BL/6 mice were challenged with 106 C1498.GFP cells IV. Twelve days later, mice were killed and livers were surgically removed. After generation of single-cell suspensions, the specimens were analyzed by flow cytometry after staining with an anti–PD-L1 antibody and gating on GFP+ cells.
Figure 3
Figure 3
Improved survival and augmented immune responses in PD-1−/− mice challenged with C1498.GFP. (A) Survival rates of C57BL/6 (●) or PD-1−/− mice (○) challenged with 106 C1498.GFP cells IV (P = .002 for the comparison of survival between PD-1−/− and C57BL/6 mice). (B) Peripheral blood was sampled from a PD-1−/− mouse and a C57BL/6 mouse 13 days after IV injection of C1498.GFP and was analyzed by flow cytometry for GFP+ cells. Gating was initially performed on the total WBC population on the FSC versus SSC gate. GFP+ cells present in the WBC population were gated in a SSC versus GFP plot. The numbers above the GFP+ cell gate represent the percentage of GFP+ cells divided by the percentage of WBCs in the FSC versus SSC plot and multiplied by 100. (C) Cohorts of 5 PD-1−/− and C57BL/6 mice received 106 C1498.GFP cells IV. On days 10, 13, 15, and 19 after tumor challenge, peripheral blood was sampled from each mouse. Red blood cells were removed via exposure to ACK lysis buffer, and samples were analyzed by flow cytometry. The percentage of leukemia cells was calculated as the GFP+ cells/% total WBCs. Closed circles and open circles represent the mean percentage of GFP+ cells at each time point from C57BL/6 and PD-1−/− mice, respectively. (D) Spleens were harvested from C57BL/6 or PD-1−/− mice 12 days after IV injection with C1498.GFP cells. A total of 106 splenocytes from individual mice were restimulated overnight with either complete DMEM, 5 × 10⁴ irradiated C1498.GFP cells (10 000 rad) or PMA + ionomycin in an IFN-γ ELISPOT assay. Bars represent the mean number of spot-forming cells (± SD) in each group (P < .001 for the comparison between PD-1−/− and C57BL/6 mice). Similar results were obtained in 2 independent experiments.
Figure 4
Figure 4
Augmented priming and effector function of tumor antigen-specific T cells in PD-1−/− mice challenged with C1498.SIY. (A) Groups of C57BL/6 or PD-1−/− mice were challenged with 106 C1498.SIY cells IV. Seven days later, spleens from tumor-bearing or control mice were harvested and the frequencies of SIY+CD8+ T cells present in each mouse were analyzed by flow cytometry after staining with SIY-Kb tetramers. Bars represent the mean frequency of SIY+CD8+/total CD8+ T cells (± SD) in each group (P = .05 for the comparison of the frequency of SIY+CD8+ cells present in PD-1−/− vs C57BL/6 mice). (B) IFN-γ ELISPOT performed on spleen cells harvested from tumor-bearing or control mice as in panel A. A total of 106 splenocytes from individual mice were stimulated with complete DMEM, SIY peptide (80 nM), irradiated C1498.SIY tumor cells, or PMA + ionomycin overnight; they were then analyzed for IFN-γ spot production. Bars represent the mean number of spot-forming cells (± SD) in each group (P < .001 for the comparison between IFN-γ spots produced by PD-1−/− vs C57BL/6 spleen cells after restimulation via SIY peptide and irradiated C1498.SIY cells). (C) Survival of PD-1−/− and C57BL/6 mice after IV injection of 106 C1498.SIY cells (P = .002 for the comparison of survival between PD-1−/− and C57BL/6 mice).
Figure 5
Figure 5
Anti–PD-L1 treatment decreases intrahepatic tumor burden and improves antitumor immune responses against C1498.GFP. (A) Cohorts of C57BL/6 mice were inoculated with 106 C1498.GFP cells IV, and received 200 μg of anti–PD-L1 or isotype control antibody IP on days 0, 3, 6, and 9. On day 12, livers were removed, and single-cell suspensions were generated, pooled between mice, and analyzed by flow cytometry for the percentage of GFP+ cells present. (B) Liver sections from C57BL/6 mice treated with isotype control (left) or PD-L1 blocking antibody (right) were stained with hematoxylin and eosin and imaged with a Zeiss Axioshop histology microscope using bright-field objective lenses. Top panels, 4× magnification; bottom panels, 20× magnification. Images were acquired with Zeiss Imaging Software, Version 4.7.1. (C) Spleens were harvested from tumor-challenged C57BL/6 mice treated with isotype control or PD-L1 blocking antibody 12 days after injection with C1498.GFP. A total of 106 splenocytes from individual mice were restimulated overnight with either complete DMEM, 5 × 10⁴ irradiated C1498.GFP cells (10 000 rad), or PMA plus ionomycin in an IFN-γ ELISPOT assay. Bars represent the mean number of spot-forming cells (± SD) in each group. P = .001 for the comparison between mice treated with PD-L1 blocking antibody versus isotype control antibody. (D) Livers were harvested from C57BL/6 mice 12 days after C1498.GFP injection. Sections from various mice were stained with anti-CD4 and -CD8 antibodies, and the numbers of CD4+ and CD8+ cells from each liver were enumerated per high-power field (hpf; 40×). Similar results were obtained in 3 independent experiments.

Comment in

References

    1. Urban JL, Schreiber H. Tumor antigens. Annu Rev Immunol. 1992;10:617–644. - PubMed
    1. Gajewski TF, Meng Y, Blank C, et al. Immune resistance orchestrated by the tumor microenvironment. Immunol Rev. 2006;213:131–145. - PubMed
    1. Townsend SE, Allison JP. Tumor rejection after direct costimulation of CD8+ T cells by B7-transfected melanoma cells. Science. 1993;259:368–370. - PubMed
    1. Zou W. Regulatory T cells, tumour immunity and immunotherapy. Nat Rev Immunol. 2006;6:295–307. - PubMed
    1. Leach DR, Krummel MF, Allison JP. Enhancement of antitumor immunity by CTLA-4 blockade. Science. 1996;271:1734–1736. - PubMed

Publication types

MeSH terms