. 2009 Jul 2;114(1):157-64.
doi: 10.1182/blood-2008-04-151639. Epub 2009 May 5.

Mitochondrial clearance is regulated by Atg7-dependent and -independent mechanisms during reticulocyte maturation

Affiliations

Mitochondrial clearance is regulated by Atg7-dependent and -independent mechanisms during reticulocyte maturation

Ji Zhang et al. Blood. .

Abstract

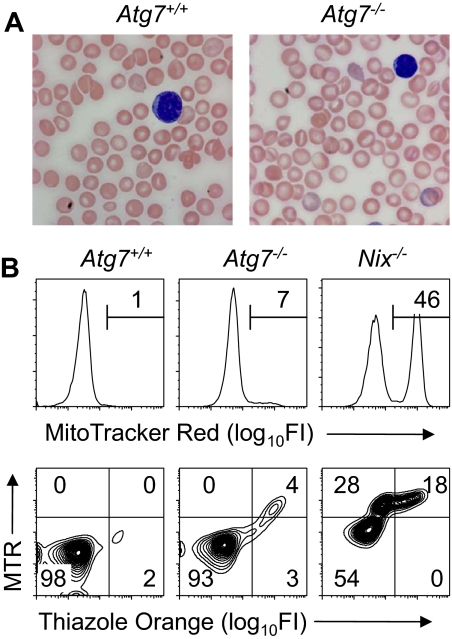
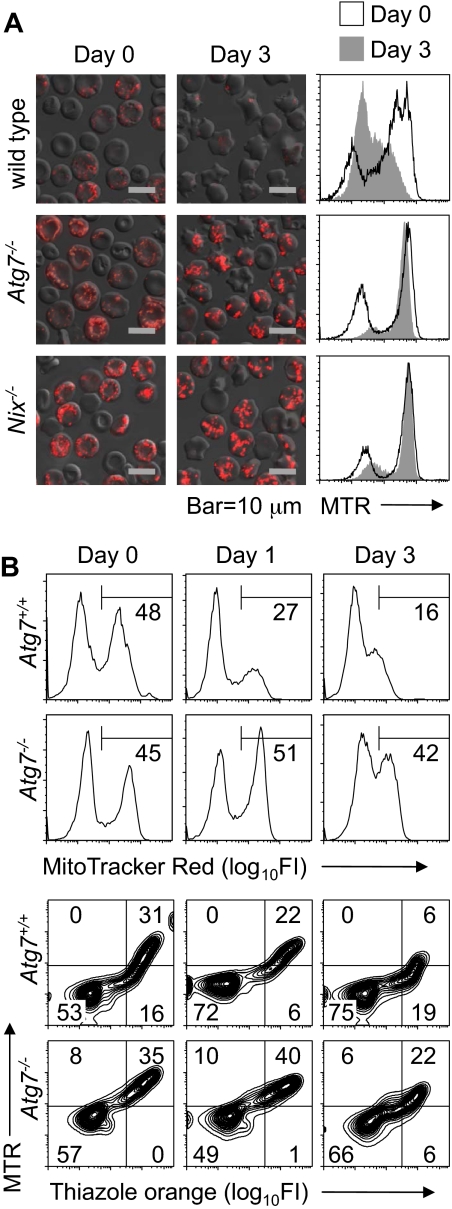
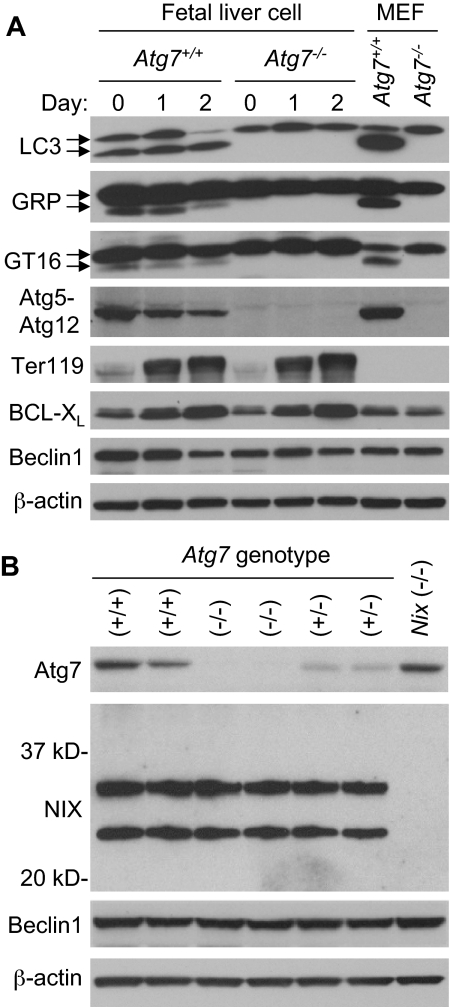
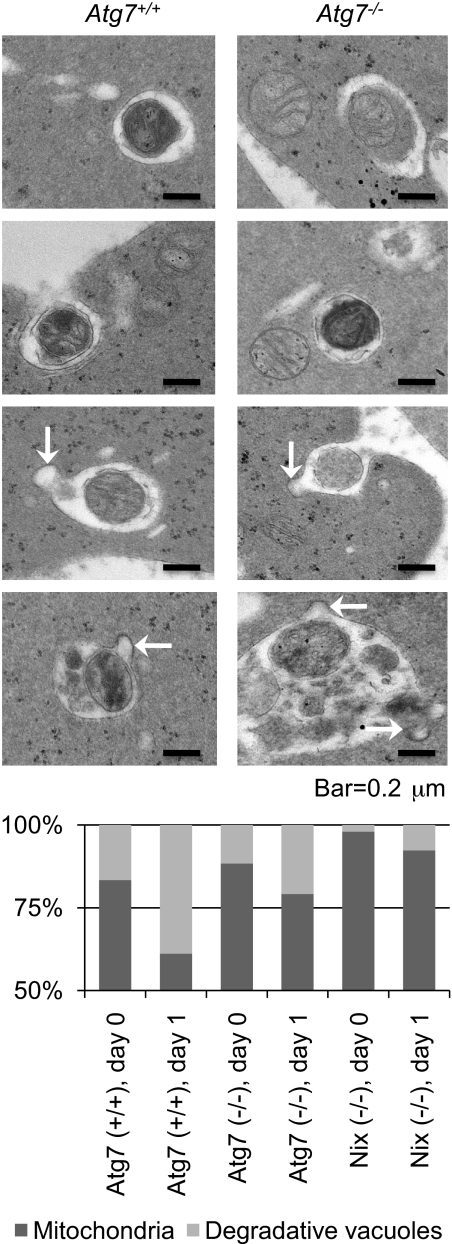
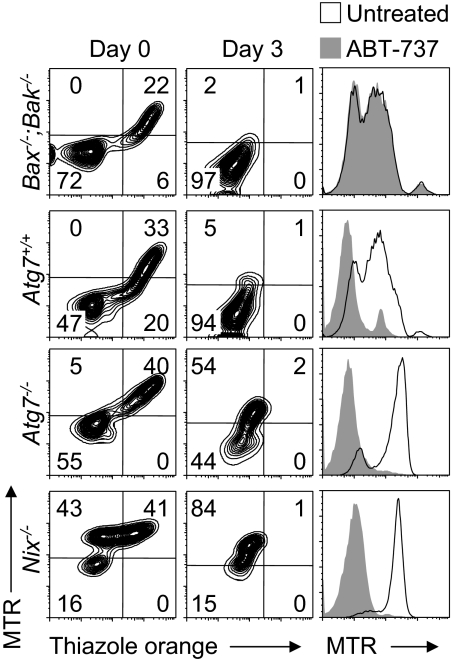
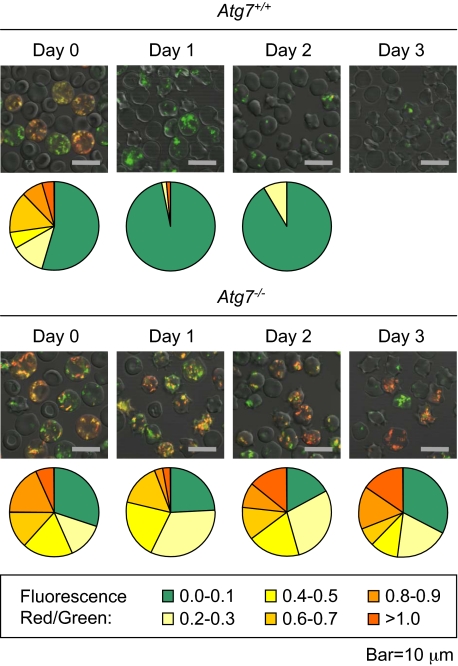
Mitochondrial clearance is a well recognized but poorly understood biologic process, and reticulocytes, which undergo programmed mitochondrial clearance, provide a useful model to study this phenomenon. At the ultrastructural level, mitochondrial clearance resembles an autophagy-related process; however, the role of autophagy in mitochondrial clearance has not been established. Here we provide genetic evidence that autophagy pathways, initially identified in yeast, are involved in mitochondrial clearance from reticulocytes. Atg7 is an autophagy protein and an E1-like enzyme, which is required for the activity of dual ubiquitin-like conjugation pathways. Atg7 is required for the conjugation of Atg12 to Atg5, and Atg8 to phosphatidylethanolamine (PE), and is essential for autophagosome formation. In the absence of Atg7, mitochondrial clearance from reticulocytes is diminished but not completely blocked. Mammalian homologs of Atg8 are unmodified in Atg7(-/-) erythroid cells, indicating that canonical autophagy pathways are inactive. Thus, mitochondrial clearance is regulated by both autophagy-dependent and -independent mechanisms. In addition, mitochondria, which depolarize in wild-type cells before elimination, remain polarized in Atg7(-/-) reticulocytes in culture. This suggests that mitochondrial depolarization is a consequence rather than a cause of autophagosome formation in reticulocytes.


Figures

Figure 1
Figure 1
Mitochondrial clearance is preserved in unstressed Atg7−/− transplant recipients. (A) Blood smears from Atg7+/+ and Atg7−/− transplant recipients, stained with Wright-Giemsa (original magnification, ×1000). Note the increased central pallor of the Atg7−/− erythrocytes. (B) Flow cytometry of blood stained with MTR (top panels) or doubly stained with MTR and TO (bottom panels) from Atg7+/+ and Atg7−/− transplant recipients and Nix−/− mice.
Figure 2
Figure 2
Mitochondrial clearance is impaired in Atg7−/− reticulocytes. (A) Immunofluorescence and flow cytometry of reticulocyte-enriched blood cultured for 3 days in vitro from wild-type and Nix−/− mice and Atg7−/− transplant recipients. The cells are stained with MTR. The black line in the histograms corresponds to day 0, and the shaded area to day 3. The scale is indicated at the bottom. (B) Flow cytometry of blood from phlebotomized mice stained with MTR (top panels) or doubly stained with MTR and TO (bottom panels). Mice were phlebotomized for 4 days. Thereafter, a small amount of blood (10 μL) was withdrawn on days 0, 1, and 3 for analysis. Day 0 was the day after the final day of phlebotomy. Genotypes are on the left.
Figure 3
Figure 3
Deficient ubiquitin-like conjugation activity in Atg7−/− erythroid cells. (A) Western blot analyses of LC3, GABARAP (GRP), GATE-16 (GT16), Atg12, Ter119, BCL-XL, Beclin-1, and β-actin in expanded E14.5 fetal liver cells undergoing differentiation in culture for 2 days. The upper LC3 band corresponds to the unconjugated form of LC3, and the lower band corresponds to the lipid conjugated form of LC3. This same is true for the other Atg8 homologs, GABARAP and GATE-16. Wild-type murine embryonic fibroblasts (MEF) provide a positive control for the position of the unconjugated and conjugated proteins. Genotypes and days in culture are indicated at the top. (B) Western blot analyses of Atg7, NIX, Beclin-1, and β-actin in primary E14.5 fetal liver cells. NIX protein is expressed as 2 isoforms in erythroid cells, a full-length monomeric form (top band), and a shorter isoform, which has not been fully characterized (bottom band). Beclin-1 is provided as a loading control. Genotypes are indicated at the top.
Figure 4
Figure 4
Atg7-independent mitochondrial clearance is mediated by degradative vacuoles. (Top) Ultrastructure of reticulocytes from Atg7+/+ and Atg7−/− transplant recipients cultured for 1 day. The scale is indicated at the bottom. (Bottom) Quantification of mitochondria and degradative vacuoles in cultured Atg7+/+, Atg7−/−, and Nix−/− reticulocytes expressed as a ratio. Fifty digital images containing 100 to 200 mitochondria and vacuoles per sample were quantified. Genotypes and days in culture are indicated at the bottom.
Figure 5
Figure 5
ABT-737 and NIX differ in their requirement for BAX or BAK. (Left panels) Flow cytometry of reticulocyte-enriched blood from phlebotomized Bax−/−;Bak−/−, Atg7+/+, Atg7−/−, and Nix−/− mice cultured for 3 days and doubly stained with MTR and TO. Genotypes are indicated on the left. (Right panels) Flow cytometry of the same blood samples, cultured for 1 day in the presence (shaded area) or absence (black line) of ABT-737, and stained with MTR.
Figure 6
Figure 6
Mitochondrial depolarization is a consequence of autophagosome formation in reticulocytes. Immunofluorescence of reticulocyte-enriched blood from phlebotomized Atg7+/+ and Atg7−/− transplant recipients, cultured for 3 days, and doubly stained with MTG and TMRM. The mean immunofluorescence intensity per cell of all cells with mitochondria in a representative field was quantified in the red and green channels, and the ratio of the signals was determined. The higher the ratio, the greater the average mitochondrial polarization per cell. The proportion of cells within each range is represented by a chart below each picture (legend at the bottom). Approximately 50 to 100 cells were quantified per sample (field). Note that mitochondria in the Atg7−/− reticulocytes remain polarized, whereas mitochondria in Atg7+/+ reticulocytes do not. No quantification is provided for Atg7+/+ reticulocytes on day 3 due to an insufficient number of cells with mitochondria for analysis. The scale is indicated at the bottom.

References

    1. Alexeyev MF, LeDoux SP, Wilson GL. Mitochondrial DNA and aging. Clin Sci (Lond) 2004;107:355–364. - PubMed
    1. Wallace DC. A mitochondrial paradigm of metabolic and degenerative diseases, aging, and cancer: a dawn for evolutionary medicine. Annu Rev Genet. 2005;39:359–407. - PMC - PubMed
    1. Yen WL, Klionsky DJ. How to live long and prosper: autophagy, mitochondria, and aging. Physiology (Bethesda) 2008;23:248–262. - PubMed
    1. Bassnett S. Lens organelle degradation. Exp Eye Res. 2002;74:1–6. - PubMed
    1. Gronowicz G, Swift H, Steck TL. Maturation of the reticulocyte in vitro. J Cell Sci. 1984;71:177–197. - PubMed

Publication types

MeSH terms