. 2009 May 5;2(69):ra20.
doi: 10.1126/scisignal.1164302.

Complexity in transcription control at the activation domain-mediator interface

Affiliations

Complexity in transcription control at the activation domain-mediator interface

Michael A Balamotis et al. Sci Signal. .

Erratum in

  • Sci Signal. 2009 Sep 22;2(89):er8

Abstract

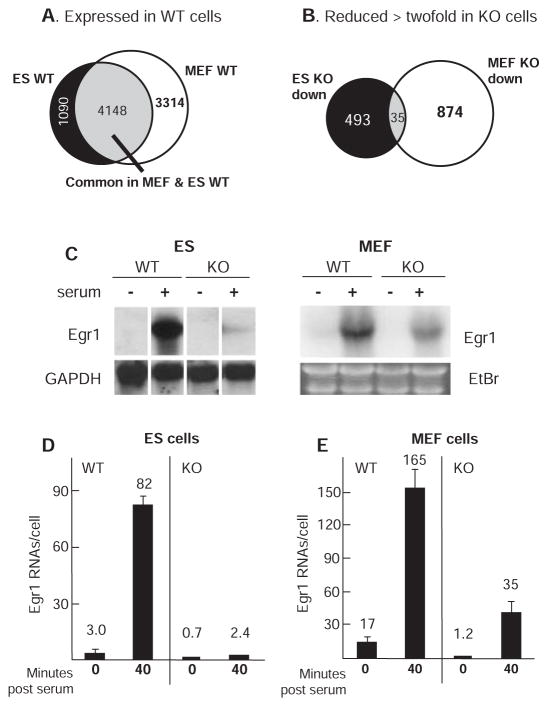
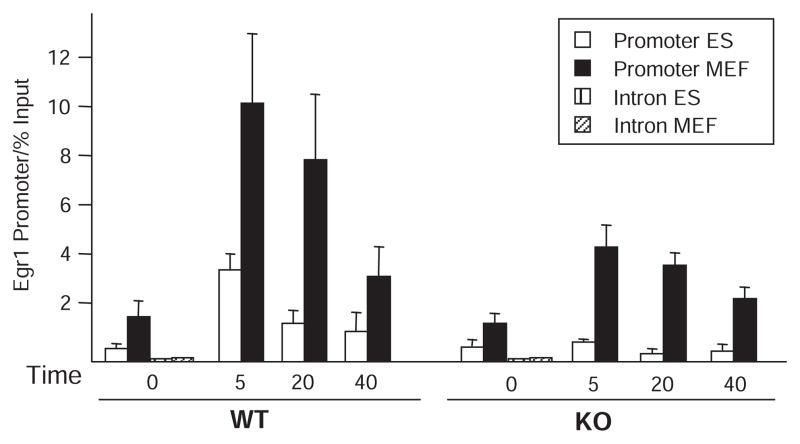
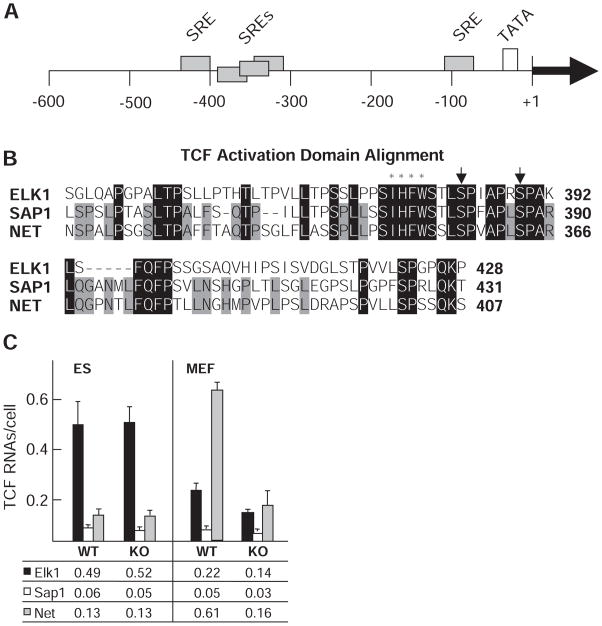
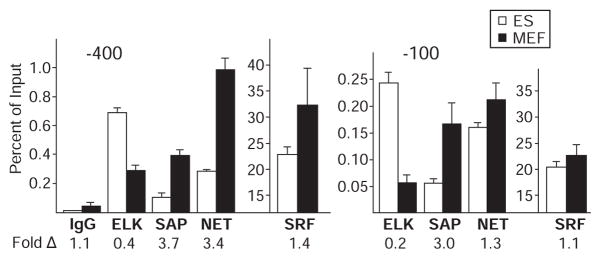
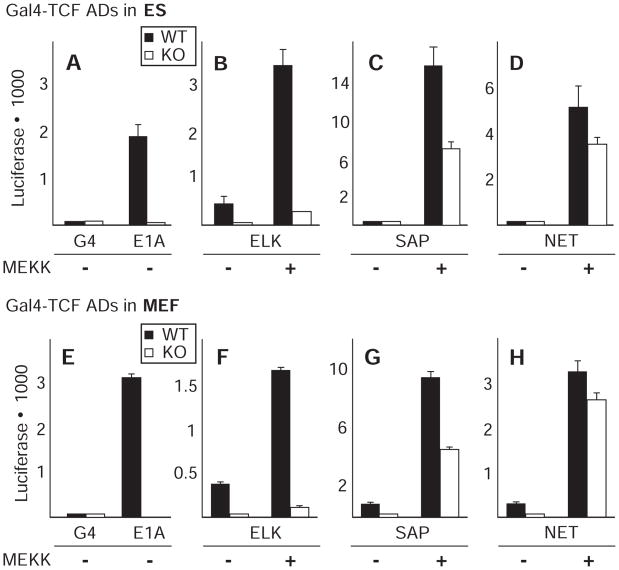
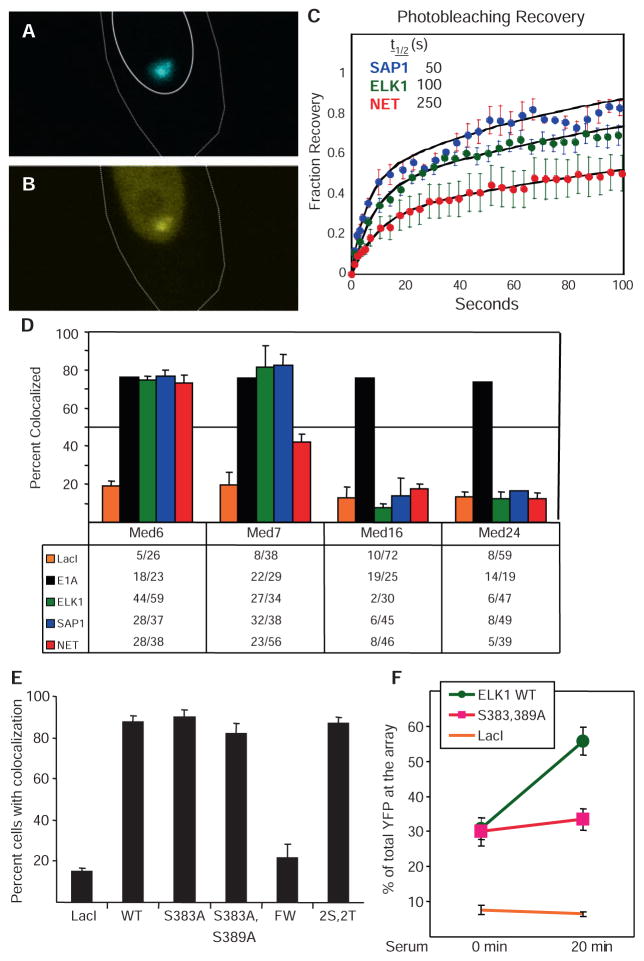
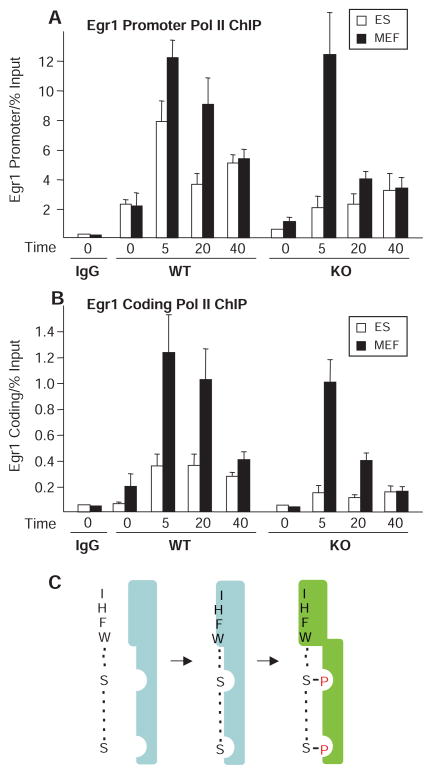
Transcript elongation by polymerase II paused at the Egr1 promoter is activated by mitogen-activated protein kinase phosphorylation of the ternary complex factor (TCF) ELK1 bound at multiple upstream sites and subsequent phospho-ELK1 interaction with mediator through the MED23 subunit. Consequently, Med23 knockout (KO) nearly eliminates Egr1 (early growth response factor 1) transcription in embryonic stem (ES) cells, leaving a paused polymerase at the promoter. Med23 KO did not, however, eliminate Egr1 transcription in fibroblasts. Chromatin immunoprecipitation analysis and direct visualization of fluorescently labeled TCF derivatives and mediator subunits revealed that three closely related TCFs bound to the same control regions. The relative amounts of these TCFs, which responded differently to the loss of MED23, differed in ES cells and fibroblasts. Transcriptome analysis suggests that most genes expressed in both cell types, such as Egr1, are regulated by alternative transcription factors in the two cell types that respond differently to the same signal transduction pathways.


Figures

Fig. 1
Fig. 1
Gene expression profiles and Egr1 transcript levels in ES and MEF cells. Total RNA from cells induced with 20% FBS for 30 min was harvested for (A) microarray gene expression profiling of WT cells. The intersection indicates genes expressed in both cell types. Analysis of Med23 KO cells treated in the same way showed the overlap of genes reduced twofold or more in KO ES and MEF cells (B). (C) Northern blot of Egr1 mRNA from WT and KO ES and MEF cells serum-starved for 16 hours (− serum) or stimulated for 30 min in 20% serum. GAPDH, glyceraldehyde-3-phosphate dehydrogenase. (D) Egr1-specific qRT-PCR with complementary DNA (cDNA) from ES cells with and without 40 min of serum stimulation. y axis, Egr1 RNA molecules per cell. Error bars indicate SD from four independent experiments. (E) Egr1 message levels in MEFs prepared as in (D).
Fig. 2
Fig. 2
Time course of mediator binding to the Egr1 promoter in ES and MEF cells. ChIP for mediator at the Egr1 promoter in ES (white bars) and MEF (black bars) WT and KO cells in replicate. Sheared chromatin was immunoprecipitated with antibodies to both MED1 and MED17 to maximize the mediator ChIP signal. Samples were quantitated by real-time PCR and normalized to percent of signal relative to input chromatin. Egr1 intron PCRs at t = 0 for ES (left) and MEF cells (right) show the background, nonspecific signal from the ChIP. After 16 hours of serum-starvation, 20% FBS was added for 0, 5, 20, or 40 min before formaldehyde cross-linking. Error bars indicate SD from four independent experiments.
Fig. 3
Fig. 3
Egr1 control regions, TCF ADs, and TCF transcript abundance. (A) Serum response elements (SREs) within the Egr1 promoter are marked by gray rectangles. The +1 indicates the transcription start site relative to these elements. The TATA box is shown in white. (B) Alignment of the three TCF ADs. Identical residues are marked by black rectangles. Amino acid residues exclusive to SAP and NET are marked by gray rectangles. Arrows indicate conserved serine residues needed for activation, and asterisks mark hydrophobic resides that disrupt function when mutated. (C) TCF mRNA abundance determined by qRT-PCR shown as copies per cell for Elk1 (black), Sap1 (white), and Net (gray) RNAs in WT and KO cells. Mean values from three independent determinations are listed at the bottom. Error bars indicate SD. Abbreviations for the amino acid residues are as follows: A, Ala; C, Cys; D, Asp; E, Glu; F, Phe; G, Gly; H, His; I, Ile; K, Lys; L, Leu; M, Met; N, Asn; P, Pro; Q, Gln; R, Arg; S, Ser; T, Thr; V, Val; W, Trp; and Y, Tyr.
Fig. 4
Fig. 4
TCF ChIPs at the Egr1 promoter region in Med23 KO ES and MEF cells. ChIP for TCF factors at the SRE clusters in the Egr1 promoter was done in steady-state serum conditions in replicate (n = 4) with KO ES and MEF cells. ES cell (white bars) and MEF (black bars) ChIP was done with anti-TCF, anti-SRF, or preimmune IgG for background control. Precipitated DNA was analyzed by qRT-PCR with primers for each SRE cluster and normalized as the percent of signal relative to input chromatin. Error bars indicate SD from four determinations. The fold difference between ES and MEF cells appear below each ChIP condition. Note that TCFs and SRF ChIP are plotted on different scales. This TCF ChIP was also done with WT cells and showed the same trends in factor binding (fig. S5).
Fig. 5
Fig. 5
TCF AD fusion to Gal4-DBD for luciferase assay in WT and KO cells. Gal4-DNA binding domain fusions to various ADs were tested for ability to activate transcription in ES and MEF WT (black) and KO (white) cells after transfection under serum-starved (0.5% FBS) conditions in the presence or absence of a cotransfected expression vector for dominant active MEKK. Error bars equal standard deviations from two independent experiments done in triplicate.
Fig. 6
Fig. 6
FRAP of mediator in living cells and factor colocalization imaging. Live A03.1 cells cotransfected with expression vectors for CFP-LacI-ELK1 AD and YFP-MED6 fusion proteins and DA-MEKK show localization (A) of the CFP-LacI-ELK1 AD fusion protein to the array as a single, prominent focus. YFP-MED6 also localized to this focus (B), but was also present throughout the nucleoplasm. Recovery of YFP-MED6 fluorescence after photobleaching with each TCF AD was plotted (C) as fluorescence intensity over time after bleaching (bleached signal set to 0%; prebleach signal set to 100%). (D) A03.1 cells were cotransfected with expression vectors for DA-MEKK and CFP-LacI-TCF AD fusion proteins or CFP-LacI-E1A, and YFP fusions to the indicated MED subunits. Fixed cells were scored for robust colocalization of CFP and YFP signals in two to three independent experiments. The table indicates the fraction of cells with a YFP mediator signal colocalized with a CFP-LacI AD fusion. (E) Expression vectors for CFP fused to LacI or fused to LacI plus the indicated WT or mutant ELK1 ADs were cotransfected with YFP-MED6 into A03.1 cells, and colocalization of YFP with CFP nuclear foci was scored in serum-starved cells. Mutant 2S,2T contains mutations T363A, T368A, S383A, and S389A. Mutant FW contains F378A and W379A. (F) A03.1 cells were transfected with expression vectors for CFP-LacI-fused to the WT ELK1 AD, to the S383A, S389A double mutant, or to CFP-LacI alone. The cells were serum-starved for 22 hours and fixed without further treatment, or 20 min after addition of 20% FBS. Fixed cells were analyzed by confocal microscopy. The ratio of YFP signal at the lacO array to total nuclear YFP signal was quantified with ImageJ software to determine the percent increase of YFP intensity (y axis) at the array after serum addition in 30 to 40 cells from two independent experiments. Movie 1 shows time-lapse fluorescence confocal microscopy of the binding of YFP-MED23 to the focus of CFP-LacI-ELK1 in the nucleus of a living A03.1 cell after addition of serum to serum-starved cells.
Fig. 7
Fig. 7
RNA Pol II ChIP time course in ES and MEF cells and model for ELK1 AD interaction with MED23. ChIP for Pol II at the Egr1 promoter (A) and ~4 kb downstream (B) in ES (white) and MEF (black) WT and KO cells. Background signal with preimmune IgG for WT cells at time 0 is shown. Samples were quantitated by real-time PCR and normalized to percent of input chromatin. Cells were starved and 20% FBS was added for 0, 5, 20, or 40 min before cross-linking. Error bars indicate SDs from three independent experiments. (C) Model for ELK1 AD interaction with MED23. The ELK1 IHFW sequence makes a hydrophobic interaction with MED23 (light blue) that provides much of the energy for mediator binding. MED23 interactions with phosphates added to the ELK1 regulatory serines by a MAPK enhance binding directly and also induce a conformational change in MED23 (light green) that stabilizes this interaction. This conformational change also results in increased binding of Pol II to the Egr1 promoter and an increase in the percentage of Pol II molecules that transcribe away from the promoter region.

References

    1. Park JM, Kim HS, Han SJ, Hwang MS, Lee YC, Kim YJ. In vivo requirement of activator-specific binding targets of mediator. Mol Cell Biol. 2000;20:8709–8719. - PMC - PubMed
    1. Zhang F, Sumibcay L, Hinnebusch AG, Swanson MJ. A triad of subunits from the Gal11/tail domain of Srb mediator is an in vivo target of transcriptional activator Gcn4p. Mol Cell Biol. 2004;24:6871–6886. - PMC - PubMed
    1. Swanson MJ, Qiu H, Sumibcay L, Krueger A, Kim SJ, Natarajan K, Yoon S, Hinnebusch AG. A multiplicity of coactivators is required by Gcn4p at individual promoters in vivo. Mol Cell Biol. 2003;23:2800–2820. - PMC - PubMed
    1. Drysdale CM, Jackson BM, McVeigh R, Klebanow ER, Bai Y, Kokubo T, Swanson M, Nakatani Y, Weil PA, Hinnebusch AG. The Gcn4p activation domain interacts specifically in vitro with RNA polymerase II holoenzyme, TFIID, and the Adap-Gcn5p coactivator complex. Mol Cell Biol. 1998;18:1711–1724. - PMC - PubMed
    1. Chen W, Roeder RG. The Mediator subunit MED1/TRAP220 is required for optimal glucocorticoid receptor-mediated transcription activation. Nucleic Acids Res. 2007;35:6161–6169. - PMC - PubMed

MeSH terms