

doi: 10.1088/0957-4484/20/6/065101.
Epub 2009 Jan 14.
Multiplex detection of breast cancer biomarkers using plasmonic molecular sentinel nanoprobes
Affiliations
- PMID: 19417369
- PMCID: PMC4022306
- DOI: 10.1088/0957-4484/20/6/065101
Item in Clipboard
Multiplex detection of breast cancer biomarkers using plasmonic molecular sentinel nanoprobes
Nanotechnology.
.
Abstract
We have demonstrated for the first time the feasibility of multiplex detection using the surface-enhanced Raman scattering-based molecular sentinel (MS) technology in a homogeneous solution. Two MS nanoprobes tagged with different Raman labels were used to detect the presence of the erbB-2 and ki-67 breast cancer biomarkers. The multiplexing capability of the MS technique was demonstrated by mixing the two MS nanoprobes and tested in the presence of single or multiple DNA targets.
Figures
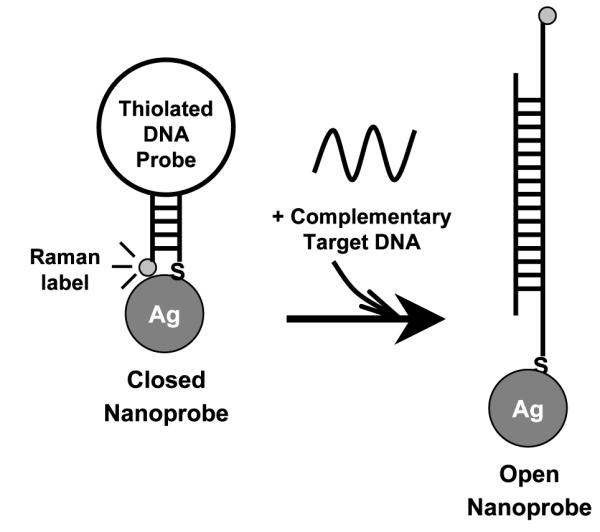
The operating principle of the SERS-based molecular sentinel (MS) nanoprobes. The MS nanoprobe is composed of a Raman-labeled DNA hairpin probe and a silver nanoparticle. In the absence of the complementary target DNA, a strong SERS signal is observed due to the hairpin conformation adopted by the MS nanoprobe (left: closed state). In the presence of the complementary target DNA, the hairpin conformation of the MS nanoprobe is disrupted and the SERS signal is quenched due to the physical separation of the Raman label from the surface of the silver nanoparticle (right: open state).
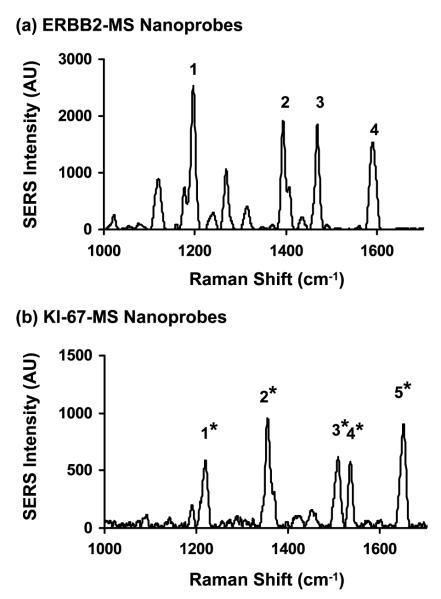
SERS spectra of the ERBB2-MS (a) and KI-67-MS (b) nanoprobes in 20 mM tris-HCl buffer (pH 8.0) containing 5 mM MgCl2. The major Raman bands are labeled as follows: ERBB2-MS: (1) 1197 cm−1, (2) 1393 cm−1, (3) 1468 cm−1, (4) 1590 cm−1. KI-67-MS: (1*) 1218 cm−1, (2*) 1354 cm−1, (3*) 1508 cm−1, (4*) 1535 cm−1, (5*) 1650 cm−1.
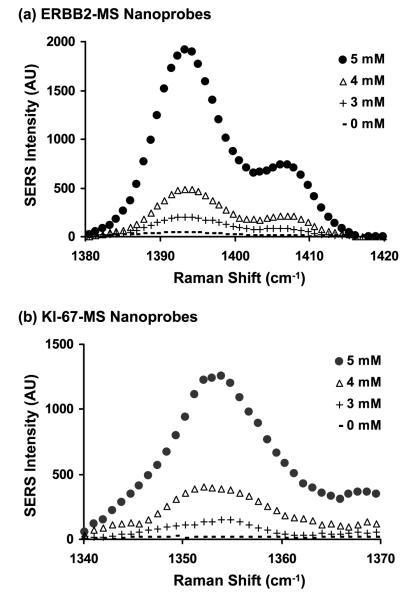
The effect of MgCl2 concentration on the SERS intensity of one of the major Raman bands (peak #2: 1393 cm−1) from the ERBB2-MS nanoprobes (a) and (peak #2*: 1354 cm−1) from the KI-67-MS nanoprobes (b). (●): 5 mM, (▵): 4 mM, (+): 3 mM, (−): 0 mM.
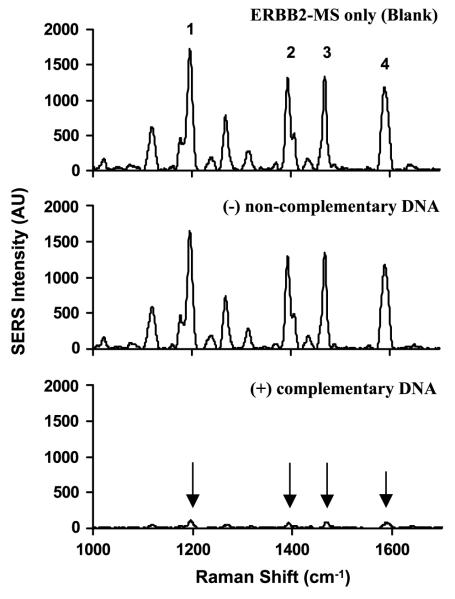
SERS spectra of the ERBB2-MS nanoprobes in the presence or absence of complementary DNA targets. Upper spectrum: blank (no target DNA present). Middle spectrum: in the presence of 0.5 μM non-complementary DNA (negative control). Lower spectrum: in the presence of 0.5 μM complementary target DNA (positive diagnostic).
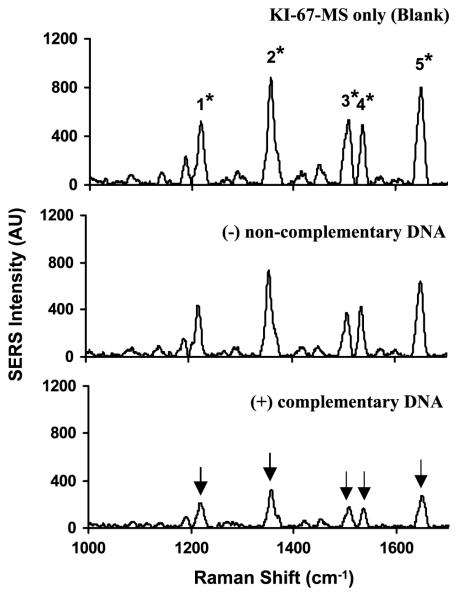
SERS spectra of the KI-67-MS nanoprobes in the presence or absence of complementary DNA targets. Upper spectrum: blank (no target DNA present). Middle spectrum: in the presence of 0.5 μM non-complementary DNA (negative control). Lower spectrum: in the presence of 0.5 μM complementary target DNA (positive diagnostic).
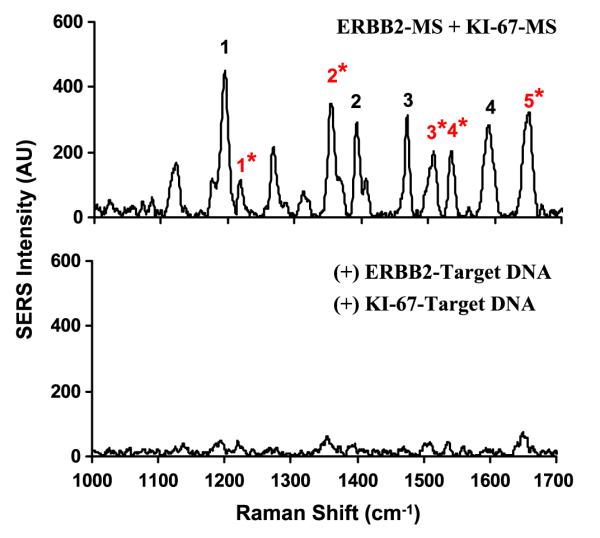
SERS spectra of the composite MS nanoprobes (ERBB2-MS + KI-67-MS) in the presence or absence of target DNA. The major Raman bands from ERBB2-MS are marked with black number, and the major Raman bands from KI-67-MS are marked with red number with (*) sign. Upper spectrum: blank (in the absence of any target DNA). Lower spectrum: in the presence of two target DNA complementary to both MS nanoprobes.
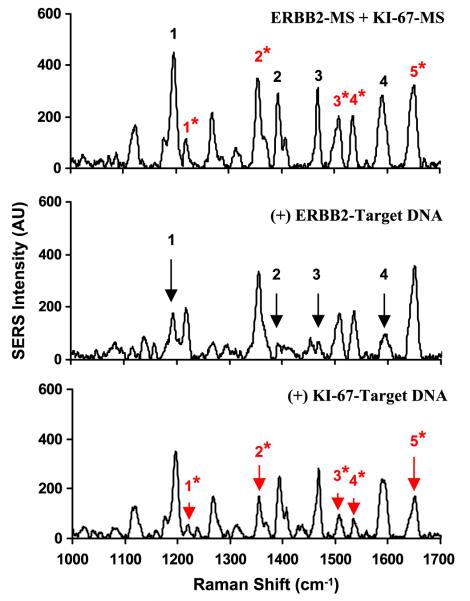
SERS spectra of the composite MS nanoprobes (ERBB2-MS + KI-67-MS) in the presence or absence of single target DNA. The major Raman bands from ERBB2-MS are marked with black number, and the major Raman bands from KI-67-MS are marked with red number with (*) sign. Upper spectrum: blank (in the absence of any target DNA). Middle spectrum: in the presence of single target DNA complementary to the ERBB2-MS nanoprobes. Lower spectrum: in the presence of single target DNA complementary to the KI-67-MS nanoprobes. The arrow signs illustrate the decreased SERS intensity of the major Raman bands in the presence of corresponding target DNA.
Similar articles
-
Multiplex detection of disease biomarkers using SERS molecular sentinel-on-chip.Anal Bioanal Chem. 2014 May;406(14):3335-44. doi: 10.1007/s00216-014-7648-4. Epub 2014 Feb 28. Anal Bioanal Chem. 2014. PMID: 24577572
-
Multicolor Cocktail for Breast Cancer Multiplex Phenotype Targeting and Diagnosis Using Bioorthogonal Surface-Enhanced Raman Scattering Nanoprobes.Anal Chem. 2019 Sep 3;91(17):11045-11054. doi: 10.1021/acs.analchem.9b01382. Epub 2019 Aug 13. Anal Chem. 2019. PMID: 31361124
-
Surface-enhanced Raman scattering molecular sentinel nanoprobes for viral infection diagnostics.Anal Chim Acta. 2013 Jul 5;786:153-8. doi: 10.1016/j.aca.2013.05.017. Epub 2013 May 20. Anal Chim Acta. 2013. PMID: 23790305 Free PMC article.
-
Application prospective of nanoprobes with MRI and FI dual-modality imaging on breast cancer stem cells in tumor.J Nanobiotechnology. 2016 Jun 23;14(1):52. doi: 10.1186/s12951-016-0195-8. J Nanobiotechnology. 2016. PMID: 27339420 Free PMC article. Review.
-
Plasmonic nanoprobes: from chemical sensing to medical diagnostics and therapy.Nanoscale. 2013 Nov 7;5(21):10127-40. doi: 10.1039/c3nr03633b. Epub 2013 Sep 20. Nanoscale. 2013. PMID: 24056945 Free PMC article. Review.
Cited by
-
Challenges in the development of future treatments for breast cancer stem cells.Breast Cancer (Dove Med Press). 2010 Mar 10;2:1-11. eCollection 2010. Breast Cancer (Dove Med Press). 2010. PMID: 25114585 Free PMC article. Review.
-
Bioanalytical applications of surface-enhanced Raman spectroscopy: de novo molecular identification.Rev Anal Chem. 2017 Dec;36(4):20160037. doi: 10.1515/revac-2016-0037. Epub 2017 Jul 5. Rev Anal Chem. 2017. PMID: 29398776 Free PMC article.
-
Plasmonic Nanoparticles and Nanowires: Design, Fabrication and Application in Sensing.J Phys Chem C Nanomater Interfaces. 2010 Apr 29;114(16):7480-7488. doi: 10.1021/jp911355q. J Phys Chem C Nanomater Interfaces. 2010. PMID: 24839505 Free PMC article.
-
Shining Gold Nanostars: From Cancer Diagnostics to Photothermal Treatment and Immunotherapy.J Immunol Sci. 2018;2(1):1-8. doi: 10.29245/2578-3009/2018/1.1104. Epub 2018 Jan 2. J Immunol Sci. 2018. PMID: 37600154 Free PMC article.
-
miRNA probe integrated biosensor platform using bimetallic nanostars for amplification-free multiplexed detection of circulating colorectal cancer biomarkers in clinical samples.Biosens Bioelectron. 2023 Jan 15;220:114855. doi: 10.1016/j.bios.2022.114855. Epub 2022 Oct 28. Biosens Bioelectron. 2023. PMID: 36332335 Free PMC article.
References
Publication types
MeSH terms
Substances
Grants and funding
LinkOut - more resources
Full Text Sources
Other Literature Sources
Medical
Research Materials
Miscellaneous