. 2009 May 21;9(10):1429-34.
doi: 10.1039/b818872f. Epub 2009 Mar 2.

Electrical detection of protein biomarkers using bioactivated microfluidic channels

Affiliations

Electrical detection of protein biomarkers using bioactivated microfluidic channels

Mehdi Javanmard et al. Lab Chip. .

Abstract

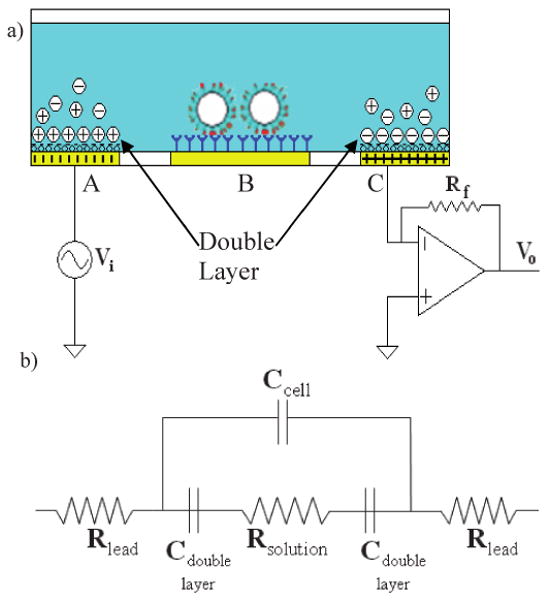
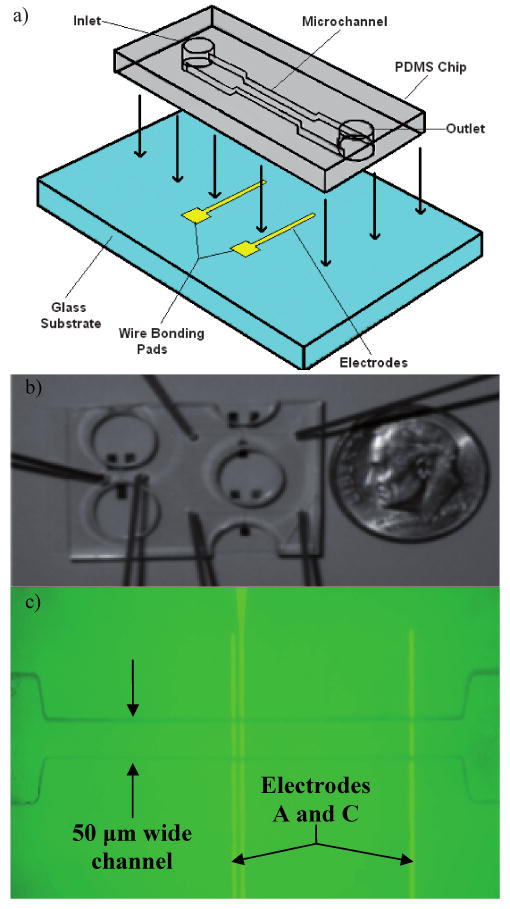
Current methods used for analyzing biomarkers involve expensive and time consuming techniques like the Sandwich ELISA which require lengthy incubation times, high reagent costs, and bulky optical equipment. We have developed a technique involving the use of a micro-channel with integrated electrodes, functionalized with receptors specific to target biomarkers. We have applied our biochip to the rapid electrical detection and quantification of target protein biomarkers using protein functionalized micro-channels. We successfully demonstrate detection of anti-hCG antibody, at a concentration of 1 ng ml(-1) and a dynamic range of three orders of magnitude, in less than one hour. We envision the use of this technique in a handheld device for multiplex high throughput analysis using an array of micro-channels for probing various protein biomarkers in clinically relevant samples such as human serum for cancer detection.


Figures

Fig. 1
Fig. 1
(a) Micron sized bead. (b) Bead coated with receptors and then (c) immersed in a multi-analyte solution. (d) Protein functionalized micro-channel biosensor. (e) The beads labeled with targeted biomarkers, in a phosphate buffered saline (PBS) solution (138 mM NaCl, 2.4 mM KCl) with a pH of 7.4, are loaded into the channel and allowed to bind to the secondary receptor molecules which are immobilized on the gold electrode forming a (f) sandwich assay at the channel surface (top plot). (Bottom plot) Prediction of resistance across electrodes A and C after injection of beads. (g) The channel is then flushed, causing the unbound beads to be removed from the channel. The magnitude of the resistance change across electrodes A and C is proportional to the target biomarker concentration.
Fig. 2
Fig. 2
(a) Side view cross section of microfluidic sensor. Positive and negative circles represent positive and negative ions accumulating at the surface of electrodes A and C. Electrode B is floating. A function generator is tied to the left electrode and a current pre-amplifier is tied to the right electrode, which is used to measure the current across the channel. (b) An equivalent circuit used in our system for understanding the impedance behavior as a function of frequency.
Fig. 3
Fig. 3
(a) Schematic of microfluidic biochip. PDMS chip and glass chip bonded together. (b) Photograph of a single chip containing three different channels with integrated electrodes. (c) Optical image of 50 μm channel with three electrodes. Resistance is measured between electrodes A and C. Electrode B is not used in this study.
Fig. 4
Fig. 4
(a) Percentage change in resistance as a function of time. The real time drop in resistance increases as the concentration of target protein biomarker decreases. (b) High concentration of target protein results in almost all beads remaining bound after washing. (c) No target protein in test sample results in almost all beads being washed off.
Fig. 5
Fig. 5
(a) The percentage of beads remaining attached in the micro-channel after incubation, with different concentrations of target protein biomarker as measured optically, establishing a dynamic range of 3 orders of magnitude. A detection limit of 1 ng ml−1 has been demonstrated. (b) The percentage decrease in ionic impedance across the channel as a function of protein biomarker concentration with standard error bars. Detection limit of 1 ng ml−1 and dynamic range of three orders of magnitude demonstrated.

References

    1. Cristofanilli M, Hayes DF, Budd GT, Ellis MJ, Stopeck A, Reuben JM, Doyle GV, Matera J, Allard WJ, Miller MC, Fritsche HA, Hortobagyi GN, Terstappen LWMM. J Clin Oncol. 2005;23:1420–1430. - PubMed
    1. Norppa H. Toxicol Lett. 2004;149:309–334. - PubMed
    1. Rifai N, Gillette MA, Carr SA. Nat Biotechnol. 2006;24:971–983. - PubMed
    1. Catalona WJ, Partin AW, Slawin KM, Brawer MK, Flanigan RC, Patel A, Richie JP, deKernion JB, Walsh PC, Scardino PT, Lange PH, Subong ENP, Parson RE, Gasior GH, Loveland KG, Southwick PC. JAMA. 1998;279:1542–1547. - PubMed
    1. Crowther JR. The ELISA Guidebook. Humana Press; Totowa, NJ: 2001.

Publication types