

Follow-up assessment of vestibular schwannomas: volume quantification versus two-dimensional measurements
- PMID: 19418046
- PMCID: PMC2710491
- DOI: 10.1007/s00234-009-0529-4
Follow-up assessment of vestibular schwannomas: volume quantification versus two-dimensional measurements
Abstract
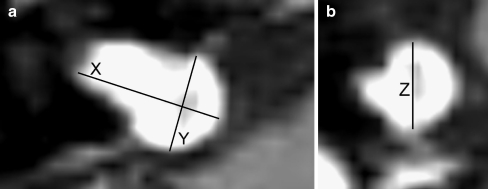
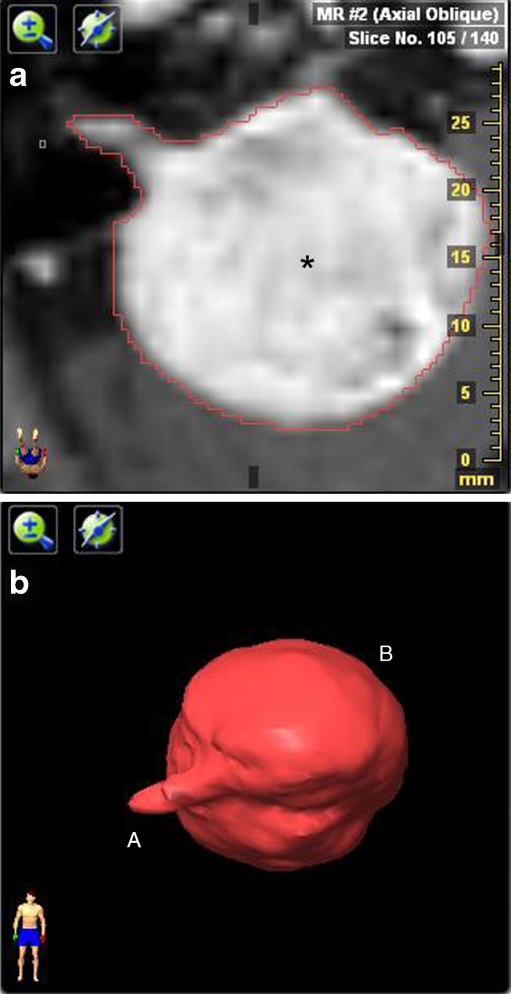
Introduction: A conservative treatment strategy is often proposed as a primary treatment option in the management of vestibular schwannomas (VS). In this "wait and scan" policy, audiovestibular symptoms are monitored regularly, and VS growth is measured on consecutive magnetic resonance images (MRI). The aim of this study is validation of two-dimensional versus volume MRI assessment in the longitudinal follow-up of VS and to define tumor growth beyond measurement error.
Methods: MRI scans of 68 consecutive patients with VS were analyzed retrospectively. Two-dimensional and volume measurements on contrast enhanced (CE) T1- and T2-weighted images were performed independently by two readers. Smallest detectable differences (SDD) were calculated, and intraclass correlation coefficients (ICCs) were determined for both assessment methods.
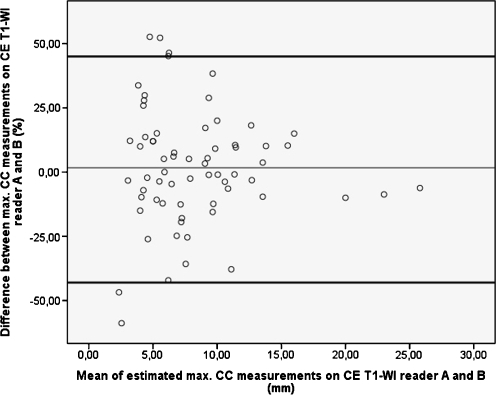
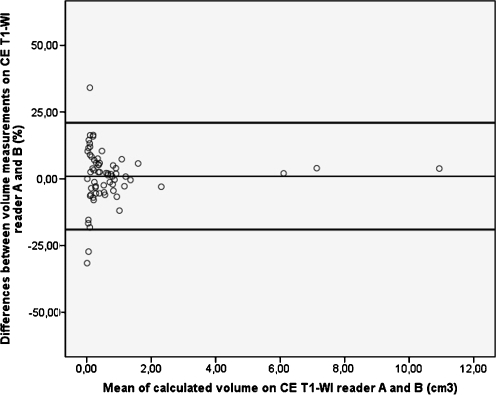
Results: Two-dimensional and volume measurements both showed best reproducibility on CE T1-weighted images. SDD for differences relative to baseline MRI [SDD (%)] for two-dimensional measurements had a higher interobserver error compared to volume measurements (40% versus 19.7%), which decreases when tumor size increases. The ICC for two-dimensional measurements in three directions was 0.947, 0.974, and 0.978 and for volume measurements 0.999.
Conclusion: Volume measurements are more accurate compared to two-dimensional measurements for the evaluation of VS growth. These measurements are assessed preferably on CE T1-weighted images. SDD (%) strongly depends on VS size. SDD between consecutive scans exceeds the common clinical applied criterion of 1 or 2 mm growth to define growth.
Figures
References
-
- {'text': '', 'ref_index': 1, 'ids': [{'type': 'PubMed', 'value': '11078076', 'is_inner': True, 'url': 'https://pubmed.ncbi.nlm.nih.gov/11078076/'}]}
- Shin YJ, Fraysse B, Cognard C, Gafsi I, Charlet JP, Berges C, Deguine O, Tremoulet M (2000) Effectiveness of conservative management of acoustic neuromas. Am J Otol 21:857–862 - PubMed
-
- {'text': '', 'ref_index': 1, 'ids': [{'type': 'DOI', 'value': '10.1097/00129492-200606000-00018', 'is_inner': False, 'url': 'https://doi.org/10.1097/00129492-200606000-00018'}, {'type': 'PubMed', 'value': '16791048', 'is_inner': True, 'url': 'https://pubmed.ncbi.nlm.nih.gov/16791048/'}]}
- Stangerup SE, Caye-Thomasen P, Tos M, Thomsen J (2006) The natural history of vestibular schwannoma. Otol Neurotol 27:547–552. doi:10.1097/00129492-200606000-00018 - PubMed
-
- {'text': '', 'ref_index': 1, 'ids': [{'type': 'DOI', 'value': '10.1017/S0022215107001077', 'is_inner': False, 'url': 'https://doi.org/10.1017/s0022215107001077'}, {'type': 'PubMed', 'value': '18088451', 'is_inner': True, 'url': 'https://pubmed.ncbi.nlm.nih.gov/18088451/'}]}
- Stangerup SE, Caye-Thomasen P, Tos M, Thomsen J (2008) Change in hearing during ‘wait and scan’ management of patients with vestibular schwannoma. J Laryngol Otol 122:673–681. doi:10.1017/S0022215107001077 - PubMed
-
- {'text': '', 'ref_index': 1, 'ids': [{'type': 'DOI', 'value': '10.1097/00005537-200010000-00030', 'is_inner': False, 'url': 'https://doi.org/10.1097/00005537-200010000-00030'}, {'type': 'PubMed', 'value': '11037833', 'is_inner': True, 'url': 'https://pubmed.ncbi.nlm.nih.gov/11037833/'}]}
- Charabi S, Tos M, Thomsen J, Charabi B, Mantoni M (2000) Vestibular schwannoma growth: the continuing controversy. Laryngoscope 110:1720–1725. doi:10.1097/00005537-200010000-00030 - PubMed
-
- {'text': '', 'ref_index': 1, 'ids': [{'type': 'DOI', 'value': '10.1097/00129492-200307000-00022', 'is_inner': False, 'url': 'https://doi.org/10.1097/00129492-200307000-00022'}, {'type': 'PubMed', 'value': '12851562', 'is_inner': True, 'url': 'https://pubmed.ncbi.nlm.nih.gov/12851562/'}]}
- Slattery WH 3rd, Fisher LM, Yoon G, Sorensen G, Lev M (2003) Magnetic resonance imaging scanner reliability for measuring changes in vestibular schwannoma size. Otol Neurotol 24:666–670. doi:10.1097/00129492-200307000-00022 discussion 670–661 - PubMed
MeSH terms
LinkOut - more resources
Full Text Sources
Medical
