. 2009 Nov;24(11):1889-904.
doi: 10.1359/jbmr.090502.

Dose-dependent effects of Runx2 on bone development

Affiliations

Dose-dependent effects of Runx2 on bone development

Shiqin Zhang et al. J Bone Miner Res. 2009 Nov.

Abstract

Runx2 controls the commitment of mesenchymal cells to the osteoblastic lineage. Distinct promoters, designated P1 and P2, give rise to functionally similar Runx2-II and Runx2-I isoforms. We postulate that this dual promoter gene structure permits temporal and spatial adjustments in the amount of Runx2 isoforms necessary for optimal bone development. To evaluate the gene dose-dependent effect of Runx2 isoforms on bone development, we intercrossed selective Runx2-II(+/-) with nonselective Runx2-II(+/-)/Runx2-I(+/-) mice to create compound mutant mice: Runx2-II(+/-), Runx2-II(+/-)/Runx2-I(+/-), Runx2-II(-/-), Runx2-II(-/-)/Runx2-I(+/-), Runx2-II(-/-)/Runx2-I(-/-). Analysis of the different Runx2-deficient genotypes showed gene dose-dependent differences in the level of expression of the Runx2 isoforms. In addition, we found that Runx2-I is predominately expressed in the perichondrium and proliferating chondrocytes, whereas Runx2-II is expressed in hypertrophic chondrocytes and metaphyseal osteoblasts. Newborn mice showed impaired development of a mineralized skeleton, bone length, and widening of the hypertrophic zone that were proportionate to the reduction in total Runx2 protein expression. Osteoblast differentiation ex vivo was also proportionate to total amount of Runx2 expression that correlated with reduced Runx2 binding to the osteocalcin promoter by quantitative chromatin immunoprecipitation analysis. Functional analysis of P1 and P2 promoters showed differential regulation of the two promoters in osteoblastic cell lines. These findings support the possibility that the total amount of Runx2 derived from two isoforms and the P1 and P2 promoters, by regulating the time, place, and amount of Runx2 in response to changing environmental cues, impacts on bone development.


Figures

FIG. 1
FIG. 1
Spatial and temporal expression of Runx2 isoforms in embryonic bone. (A) In situ hybridization with respective Runx2-I– and Runx2-II–specific antisense riboprobes (indicated by red staining) showed predominant Runx2-I expression in the perchondrium and bone collar (left first panel) and Runx2-II in terminal hypertrophic zone and trabecular bone in the metaphysis (left third panel). Type X collagen (COLX) antisense riboprobe (indicated by black staining) showed COLX expression only in the hypertrophic zone of growth plate (left second panel). In contrast, the sense probes produced no labeling (right first, second, and third panels). (B) RT-PCR of microdissected RNA from different bone sites using laser capture showed that Runx2-I is highly expressed in the trabecular bone (TB) and bone collar (BC), but weakly expressed in cartilage, including the hypertrophic zone (HZ) (first panel). In contrast, Runx2-II expression is also widely distributed but is absent in the perichondrium (second panel). Again, type X collagen expression was only expressed in the hypertrophic zone (third panel). In addition, both Runx2 isoforms but not COLX is expressed in calvarial bone (C) and MC3T3-E1 osteoblasts (MC). Cyclophilin A (CYC A) was used an internal control (bottom panel). HZ, hypertrophic zone; TB, trabecular bone; PZ, proliferation zone; BC, bone collar; PC, perichondrium; MC, MC3T3-E1; C, calvaria. (C and D) Temporal expression of Runx2 isoforms in wildtype whole embryos by real-time RT-PCR analysis. Runx2-I (C) is transiently upregulated between E11.5 and E13.5 (∼1.5-fold), and remains constant between E13.5 and E17.5. In contrast, Runx2-II (D) is progressively upregulated throughout embryonic development, reaching a maximum of 5-fold elevation between E13.5 and E 17.5. Data are expressed as the fold changes relative to the housekeeping gene Cyclophilin A and represent the mean ± SD from three to four individual samples at the indicated days of mouse gestation from E11.5 to E17.5. Values sharing the same superscript are not significantly different at p < 0.05.
FIG. 2
FIG. 2
Gross appearance, body weight, and Runx2 protein levels in compound Runx2-I and -II isoform-deficient mice. (A) Gross appearance and body weight in newborn wildtype and compound Runx2 isoform-deficient mice. Body weight (expressed in mg) represents mean ± SD from five to six mice. Values sharing the same superscript are not significantly different at p < 0.05. (B) Immunodetection of Runx2 expression in tibias from E17.5 mice. Immunostaining with anti-Runx2 antibody shows that Runx2 protein is differentially expressed in hypertrophic chondrocytes and osteoblasts in the metaphyseal region (white arrow) and in the perichondrium (yellow arrow) as a function of geneotype. Overall, the density of the nuclear staining was progressively decreased as a function of gene dose. Magnification (×100). (C) Western blot analysis of total Runx2 protein expression in calvarial osteoblasts. The top panel shows the 64- and 60-kDa bands, respectively, representing the full-length and alternatively spliced Runx2 protein.(85) The bottom panel shows the 70-kDa lamin A/C protein, which was used as a control for protein expression. The amount of Runx2 protein corresponds to the gene dose in the various genotypes.
FIG. 3
FIG. 3
Defective skeletogenesis in compound Runx2-I and -II isoform-deficient newborn mice. Alizarin red/Alcian blue staining of group 1 to group 6 newborn mice. Calcified tissues are stained red, and cartilage is stained blue. (A–F) Whole skeleton, a superior view of the skull, clavicles, hyoid bone, sternum and ribs, scapula, and forelimb (left image) and caudal vertebrae (right image), respectively. Arrows indicated delayed ossification of specific bones. Compared with the wildtype, there was a gene dose–dependent effect on skeletogenesis that included defects of both endochondral and intramembranous bone formation. Defects in skull and appendicular and axial skeleton were proportionate to the reduced gene dose in the various Runx2 genotypes. There is a progressive gene dose–dependent reduction of occipital bone, posterior zygomatic arches, and nasal bone of the skull (B). In addition, there was a gene dose–dependent defect in the distal clavicles in groups 2–4 and a total absence of the clavicle in groups 5 and 6 (C). Mineralization of the hyoid bone was absent in groups 4–6 (D). The distal ribs and sternum (E), as well as phalangeal bones and the caudal spine (F), showed a progressive delay in ossification that was proportionate to the reduction in gene dose.
FIG. 4
FIG. 4
μCT analysis of compound Runx2-I and -II isoform-deficient newborn mice. Representative 3D images of μCT analysis for the whole skeleton (A), full-length mineralized tibias (B), metaphyseal region (C), and cortical bone (D) of tibias from newborn mice. Compared with the wildtype, there was a gene dose–dependent progression of the severity of the skeletal defects in both endochondral and intramembranous bone (A), decrease in the length of mineralized portion of tibias (B), diminished bone volume (BV/TV%) in metaphyseal bone structures (C), and thinning cortical thickness (Ct.Th) in the cortical bone (D). Data below B, C, and D, respectively, represent the mean ± SD of mineralized tibia length, bone volume, and cortical thickness from four to five mice. Values sharing the same superscript are not significantly different at p < 0.05.
FIG. 5
FIG. 5
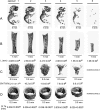
Histological and in situ analysis of tibial bone in compound Runx2-I and -II isoform-deficient E17.5 embryos. (A and B) H&E staining of decalcified tibias. (A) Low magnification (×20) showing epiphyseal and diaphyseal regions. The values below the micrograph represent the bone length (B.L.) and the length of the bone marrow cavity (BMC.L). There was a gene dose–dependent reduction in the length of tibia, formation of bone marrow cavity, and diminished metaphyseal bone formation in the various genotypes. (B) High-power magnification of growth plate (×100). The width of the hypertrophic cartilage zone (HZ) is shown below the micrograph. There is a Runx2 dose-dependent increase in length of hypertrophic zone. E, epiphysis; D, diaphysis; M, metaphysis; B.L, length of tibial bone; BMC.L, length of bone marrow cavity; GP, growth plate; RZ, resting zone; PZ, proliferation zone; HZ, hypertrophic chondrocytes zone; HZ.L, the length of hypertrophic zone. Data are expressed as the mean ± SD from four to five E17.5 embryos, and values sharing the same superscript are not significantly different at p < 0.05. (C) Expression of osteopontin by in situ hybridization. Hybridization with osteopontin antisense riboprobe was performed. We observed a gene dose–dependent reduction of osteopontin (Opn) expression (indicated by red staining) in the epiphyseal and diaphyseal regions of tibias from the compound Runx2 isoform-deficient mice.
FIG. 6
FIG. 6
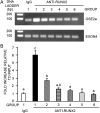
Analysis of Runx2 binding to the Osteocalcin promoter in immortalized calvarial osteoblasts using qChIP assay. (A) Ethidium bromide gel of real-time PCR products obtained with ChIP-DNAs using Runx2 antibody and OSE2a site primers in the Osteocalcin promoter. Nonspecific normal rabbit IgG was used as a negative control. (B) Bar graph of the qChIP assay from calvarial osteoblasts. ChIP–DNAs were quantified by real-time PCR using OSE2a site primers in the Osteocalcin promoter and exon 4 primers of Osteocalcin gene. Values are shown as relative fold of enrichment of the promoter sequence normalized for coding region sequence versus that obtained for input samples and represent the mean ± SD from four independent experiments. Values sharing the same superscript are not significantly different at p < 0.05.
FIG. 7
FIG. 7
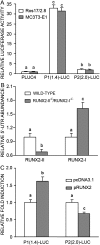
Autoregulation of Runx2 P1 and P2 promoter activity by Runx2 isoforms. (A) Relative Runx2 P1(1.4 kb)-LUC and P2(2.0 kb)-LUC promoter-luciferase reporter activity in Ros17/2.8 and MC3T3-E1 osteoblastic cell lines. (B) 5′-untranslated region (5′-UTR) mRNA levels of Runx2-II and Runx2-I isoforms in wildtype and Runx2-II−/−/Runx2-I−/−-null mice were quantified by real-time RT-PCR. Data are mean ± SD from four to five E17.5 individual mice, expressed as the fold changes relative to the housekeeping gene cyclophilin A, and normalized to wildtype mice, and values sharing the same superscript are not significantly different each other at p < 0.05. (C) Relative Runx2 P1(1.4 kb)-LUC and P2(2.0 kb)-LUC promoter-luciferase reporter activities were induced by overexpression of Runx2 using CMV-promoter driving Runx2-II full-length cDNA plasmid in MC3T3-E1 osteoblasts. Values are shown as relative fold changes to control (pcDNA3.1 vector) and represent the mean ± SD from three independent experiments. Values sharing the same superscript are not significantly different at p < 0.05.

Similar articles

Cited by

References

    1. Ducy P, Starbuck M, Priemel M, Shen J, Pinero G, Geoffroy V, Amling M, Karsenty G. A Cbfa1-dependent genetic pathway controls bone formation beyond embryonic development. Genes Dev. 1999;13:1025–1036. - PMC - PubMed
    1. Komori T, Yagi H, Nomura S, Yamaguchi A, Sasaki K, Deguchi K, Shimizu Y, Bronson RT, Gao YH, Inada M, Sato M, Okamoto R, Kitamura Y, Yoshiki S, Kishimoto T. Targeted disruption of Cbfa1 results in a complete lack of bone formation owing to maturational arrest of osteoblasts. Cell. 1997;89:755–764. - PubMed
    1. Otto F, Thornell AP, Crompton T, Denzel A, Gilmour KC, Rosewell IR, Stamp GW, Beddington RS, Mundlos S, Olsen BR, Selby PB, Owen MJ. Cbfa1, a candidate gene for cleidocranial dysplasia syndrome, is essential for osteoblast differentiation and bone development. Cell. 1997;89:765–771. - PubMed
    1. Choi JY, Pratap J, Javed A, Zaidi SK, Xing L, Balint E, Dalamangas S, Boyce B, van Wijnen AJ, Lian JB, Stein JL, Jones SN, Stein GS. Subnuclear targeting of Runx/Cbfa/AML factors is essential for tissue-specific differentiation during embryonic development. Proc Natl Acad Sci USA. 2001;98:8650–8655. - PMC - PubMed
    1. Vaes BL, Ducy P, Sijbers AM, Hendriks JM, van Someren EP, de Jong NG, van den Heuvel ER, Olijve W, van Zoelen EJ, Dechering KJ. Microarray analysis on Runx2-deficient mouse embryos reveals novel Runx2 functions and target genes during intramembranous and endochondral bone formation. Bone. 2006;39:724–738. - PubMed

Publication types

MeSH terms