. 2009 Jul 10;284(28):18651-63.
doi: 10.1074/jbc.M109.004267. Epub 2009 May 6.

Substrate binding tunes conformational flexibility and kinetic stability of an amino acid antiporter

Affiliations

Substrate binding tunes conformational flexibility and kinetic stability of an amino acid antiporter

Christian A Bippes et al. J Biol Chem. .

Abstract

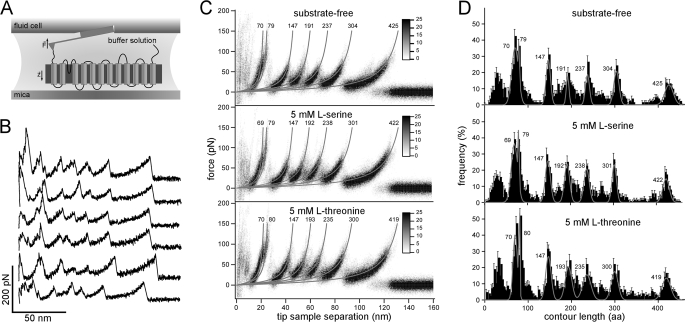
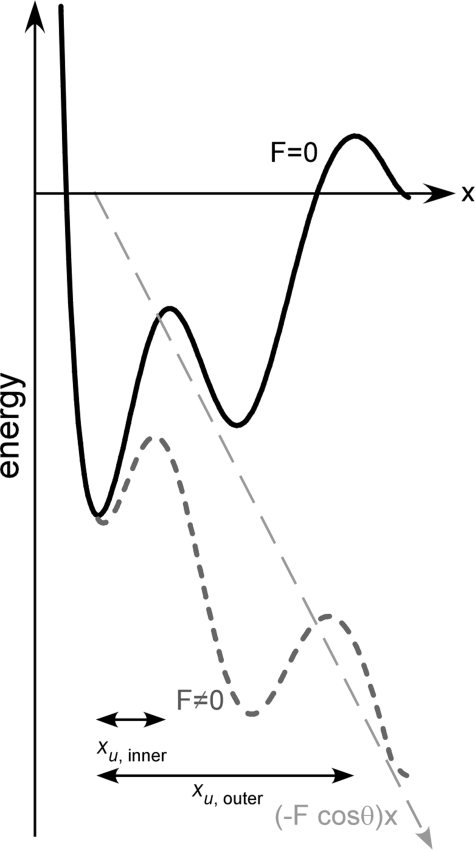
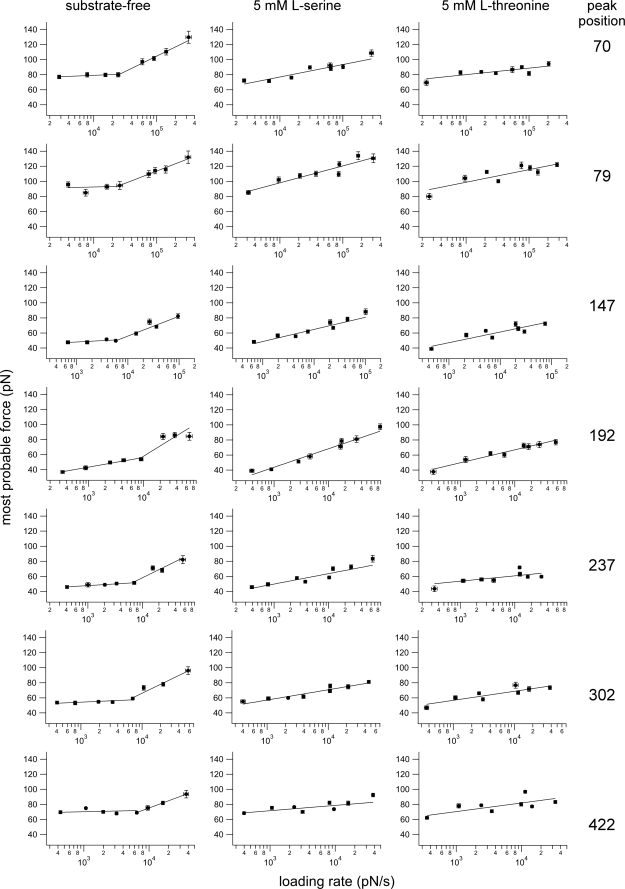
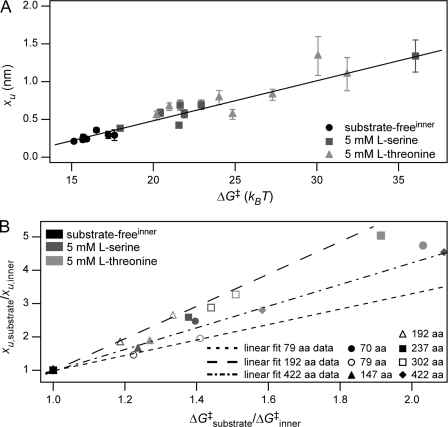
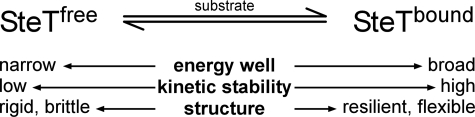
We used single molecule dynamic force spectroscopy to unfold individual serine/threonine antiporters SteT from Bacillus subtilis. The unfolding force patterns revealed interactions and energy barriers that stabilized structural segments of SteT. Substrate binding did not establish strong localized interactions but appeared to be facilitated by the formation of weak interactions with several structural segments. Upon substrate binding, all energy barriers of the antiporter changed thereby describing the transition from brittle mechanical properties of SteT in the unbound state to structurally flexible conformations in the substrate-bound state. The lifetime of the unbound state was much shorter than that of the substrate-bound state. This leads to the conclusion that the unbound state of SteT shows a reduced conformational flexibility to facilitate specific substrate binding and a reduced kinetic stability to enable rapid switching to the bound state. In contrast, the bound state of SteT showed an increased conformational flexibility and kinetic stability such as required to enable transport of substrate across the cell membrane. This result supports the working model of antiporters in which alternate substrate access from one to the other membrane surface occurs in the substrate-bound state.


Figures

FIGURE 1.
FIGURE 1.
SMFS of SteT. A, pushing the AFM stylus onto the proteoliposomes promotes contacting single transporters to the stylus. This molecular link allows exertion of a mechanical pulling force that initiates stepwise unfolding of SteT. During the experiments, sample and cantilever are immersed in buffer solution. B, F-D curves recorded while unfolding single substrate-free SteT molecules. C, superimpositions of F-D curves recorded while unfolding SteT in buffer lacking any substrate (top) and supplemented with 5 mm l-serine (middle) or 5 mm l-threonine (bottom). Superimpositions are represented as density plots, each calculated from 60 F-D curves. Gray lines represent WLC curves with a persistence length of 0.4 nm and contour length (in amino acids) as indicated by the numbers next to the lines. The contour lengths were obtained from the Gaussian fits shown in D. F-D curves were obtained at room temperature at a pulling velocity of 654 nm/s in buffer solution (150 mm NaCl, 20 mm Tris-HCl, pH 8.0, substrate as indicated). D, frequency of force peaks detected at different positions of the stretched polypeptide. Every force peak detected in individual F-D curves (B) was fitted using the WLC model with the contour length of the stretched polypeptide as the only fitting parameter. The frequency at which the force peaks appeared is plotted in the histogram: substrate-free, n = 132; 5 mm l-serine, n = 128; and 5 mm l-threonine, n = 127. The bin size of the histograms is 3 aa and reflects the accuracy of fitting the WLC model (55) to individual force peaks. Error bars representing the S.E. were calculated using S.E. = (p(1 − p)/n)0.5 where p is the probability and n is the total number of F-D curves. The width of each force peak distribution is given by the experimental noise, conformational variability of the structural segments, and fitting accuracy of the force peaks (, –102). The gray solid curve represents the sum of seven Gaussian fits to the seven main peaks from the histograms and superimpositions (C). Numbers next to peaks denote peak positions (measured in amino acids) obtained from Gaussian fits.
FIGURE 2.
FIGURE 2.
Energy landscape tilted by force. Schematic representation of the free energy profile along the reaction coordinate and applied force according to the Bell-Evans theory (–42). The potential along the reaction coordinate (vector of force) in the absence of force (black curve) exhibits two energy barriers separating the folded from the unfolded state. Application of an external force, F, changes the thermal likelihood of reaching the top of the energy barrier(s). Although for a sharp barrier the position, xu, of the energy barrier relative to the folded state is not changed, the thermally averaged projection of the energy profile along the pulling direction is tilted by the mechanical energy (−F·cos θ)x (long-dashed line). This tilt decreases the energy barriers (short-dashed curve). Consequently the relevant energy barrier that has to be overcome is the outermost barrier. At slow pulling velocities, the thermal contribution is higher, and therefore, the mechanical energy required to overcome the barrier is smaller. With increasing pulling velocities, the barriers are further lowered. At some velocity, the height of the outer barrier will be lower than that of the inner barrier (short-dashed curve), which then becomes the relevant energy barrier to be overcome. Each energy barrier manifests as a linear regime in dynamic force spectra (Fig. 3).
FIGURE 3.
FIGURE 3.
Pulling velocity-dependent response of interactions that stabilize individual segments of SteT. Fitting the rf-dependent F* (lines) using Equation 2 provides the parameters of the energy barrier that stabilizes structural segments within SteT. xu measures the distance from the energy well of the native state to the transition state, and k0 describes the kinetic transition rate at which the structural segment unfolds at zero force. Error bars represent the S.E. of force and loading rate, respectively. Fits were weighted using the S.E. of the most probable force. Experiments were performed in 150 mm NaCl, 20 mm Tris-HCl, pH 8.0 in the absence of substrates (left column) or in the presence of 5 mm l-serine (middle column) or 5 mm l-threonine (right column). Peak positions are in amino acids.
FIGURE 4.
FIGURE 4.
Correlation between xu and ΔG. A, plotting xu versus ΔG reveals their linear correlation for all structural segments of substrate-free SteT (inner barrier; black symbols) and SteT in the presence of 5 mm l-serine (dark gray symbols) or 5 mm l-threonine (light gray symbols). Error bars represent S.D. B, changes in xu and ΔG for SteT in the absence (inner barrier; black symbols) and presence of l-serine (dark gray symbols) or l-threonine (light gray symbols) with respect to the values for the inner barrier of substrate-free SteT. All structural segments revealed an apparent Hammond behavior; i.e. upon ligand binding xu increased with increasing ΔG. Short-dashed, long-dashed, and dot-dashed lines represent linear fits to the values obtained for the structural segments at 79 (open circle), 192 (open triangle), and 422 aa (filled diamond), respectively. The different slopes of these fits (2.31, 4.85, and 3.25 for the short-dashed, long-dashed, and dot-dashed lines) show that ligand binding influenced each individual structural segment differently. Data are taken from Table 3.
FIGURE 5.
FIGURE 5.
Rigidity of structural segments of SteT in the absence and presence of substrate. For substrate-free SteT, rigidity of the outer and inner energy barriers is shown. Rigidity was estimated using Equation 4 to calculate the spring constant κ from xu and ΔG obtained from DFS experiments. Errors represent S.D. and were propagated from the errors of xu and ΔG.
FIGURE 6.
FIGURE 6.
Energy landscape and mechanical properties of SteT changing upon substrate binding. In the absence of substrate (SteTfree) the inner energy barrier of SteT shows a narrow energy well exhibiting a low kinetic stability that determines a rigid and brittle structure. The second outer energy barrier of SteTfree is not shown. In presence of substrate (SteTbound) the two energy barriers stabilizing every structural segment of SteT fuse into one single energy barrier that provides SteT with very different mechanical and kinetic characteristics. The energy barrier of SteTbound is broad and shows an increased kinetic stability that shapes resilient and flexible structural segments of SteT.

Similar articles

Cited by

References

    1. Jack D. L., Paulsen I. T., Saier M. H., Jr. (2000) Microbiology 146, 1797–1814 - PubMed
    1. Verrey F., Jack D. L., Paulsen I. T., Saier M. H., Jr., Pfeiffer R. (1999) J. Membr. Biol. 172, 181–192 - PubMed
    1. Palacín M., Nunes V., Font-Llitjós M., Jiménez-Vidal M., Fort J., Gasol E., Pineda M., Feliubadaló L., Chillarón J., Zorzano A. (2005) Physiology 20, 112–124 - PubMed
    1. Calonge M. J., Gasparini P., Chillarón J., Chillón M., Gallucci M., Rousaud F., Zelante L., Testar X., Dallapiccola B., Di Silverio F., Barceló P., Estivill X., Zorzano A., Nunes V., Palacín M. (1994) Nat. Genet. 6, 420–425 - PubMed
    1. Feliubadaló L., Font M., Purroy J., Rousaud F., Estivill X., Nunes V., Golomb E., Centola M., Aksentijevich I., Kreiss Y., Goldman B., Pras M., Kastner D. L., Pras E., Gasparini P., Bisceglia L., Beccia E., Gallucci M., de Sanctis L., Ponzone A., Rizzoni G. F., Zelante L., Bassi M. T., George A. L., Jr., Manzoni M., De Grandi A., Riboni M., Endsley J. K., Ballabio A., Borsani G., Reig N., Fernández E., Estévez R., Pineda M., Torrents D., Camps M., Lloberas J., Zorzano A., Palacín M. (1999) Nat. Genet. 23, 52–57 - PubMed

Publication types

LinkOut - more resources